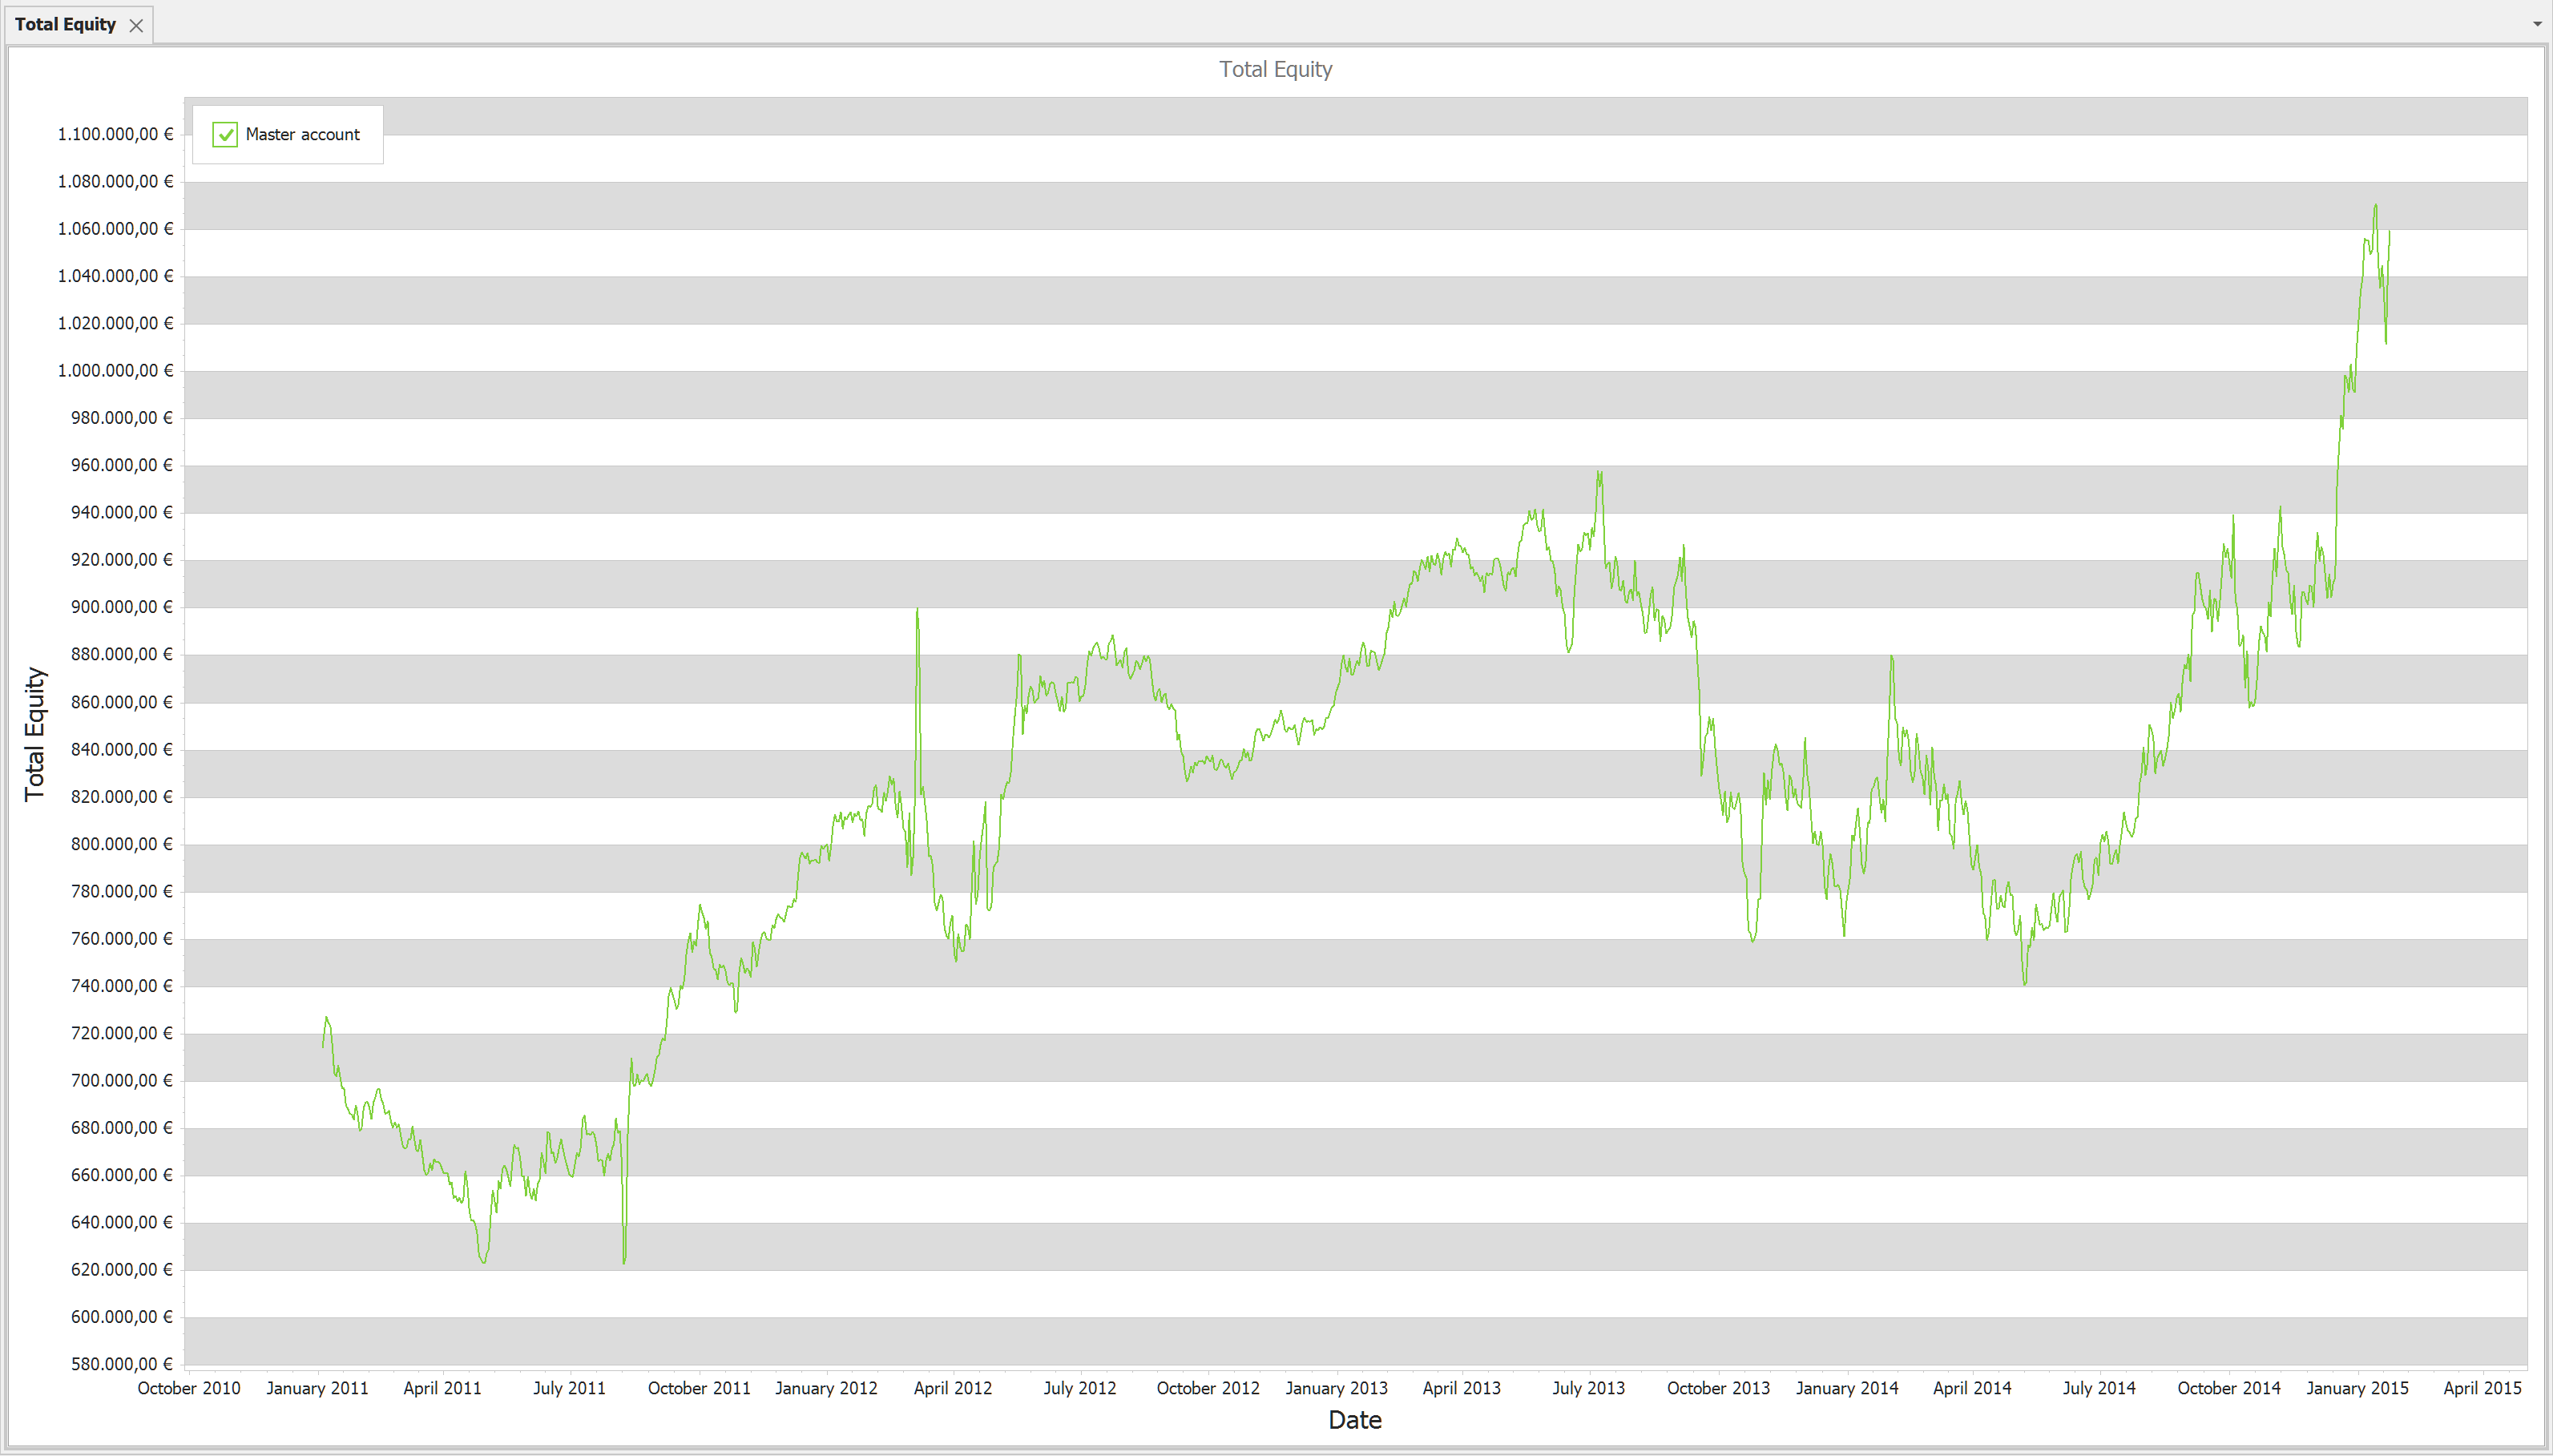
Total Equity chart is a line chart based on the Total Equity list.
With this chart you can see your total equity change by time. Each point in the chart is the total equity value from the Total Equity History. For more information please see the Trading Menu and Equity view.
X Axis: Date
Y Axis: Total equity value
Context menus (right click on the chart):
• Print preview
• Export to different document formats
• Save Image As. Saving chart as image. Supported formats are: PDF, JPG, BMP, PNG
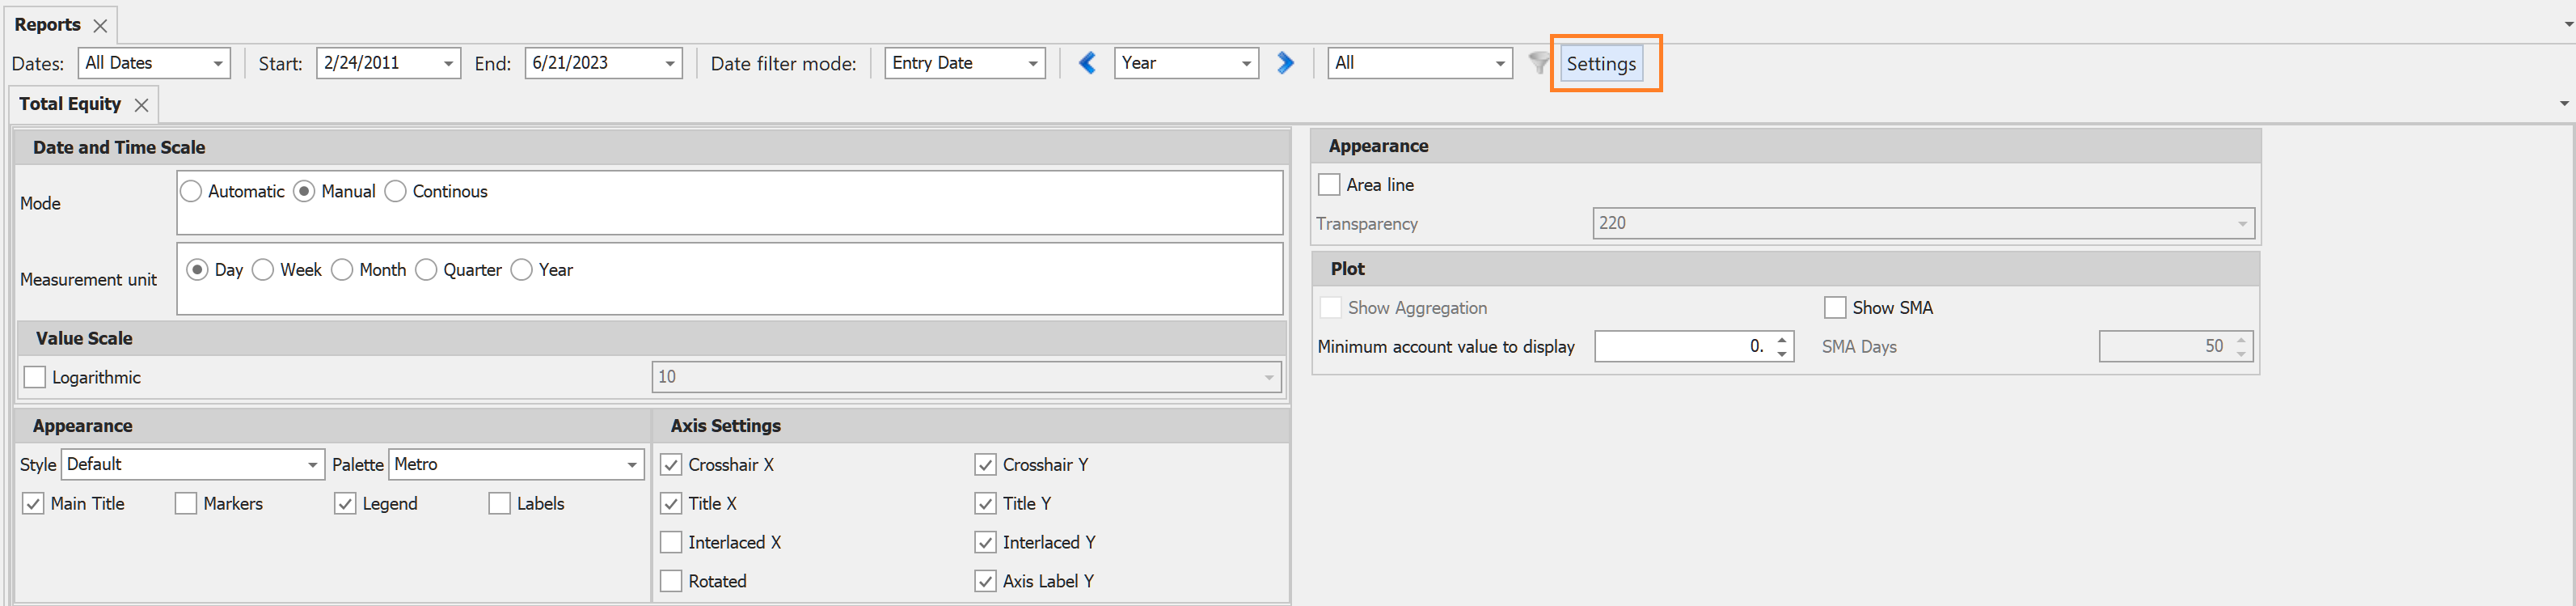
Settings
• Area line. This changes the line chart to an area line chart.
oTransparency. The transparency level can be set in case of the the Area line check box is ticked.
• Show Aggregation. In case of multiple accounts with this option the aggregated value of the accounts will be plotted.
•Minimum account value to display. In case of several accounts, sometimes useful to filter out the account with very low account value.
•Show SMA. Display a simple moving average chart of the Equity.
oSMA Days. By default it is 50.
Available filters:
Only date filters are applied.