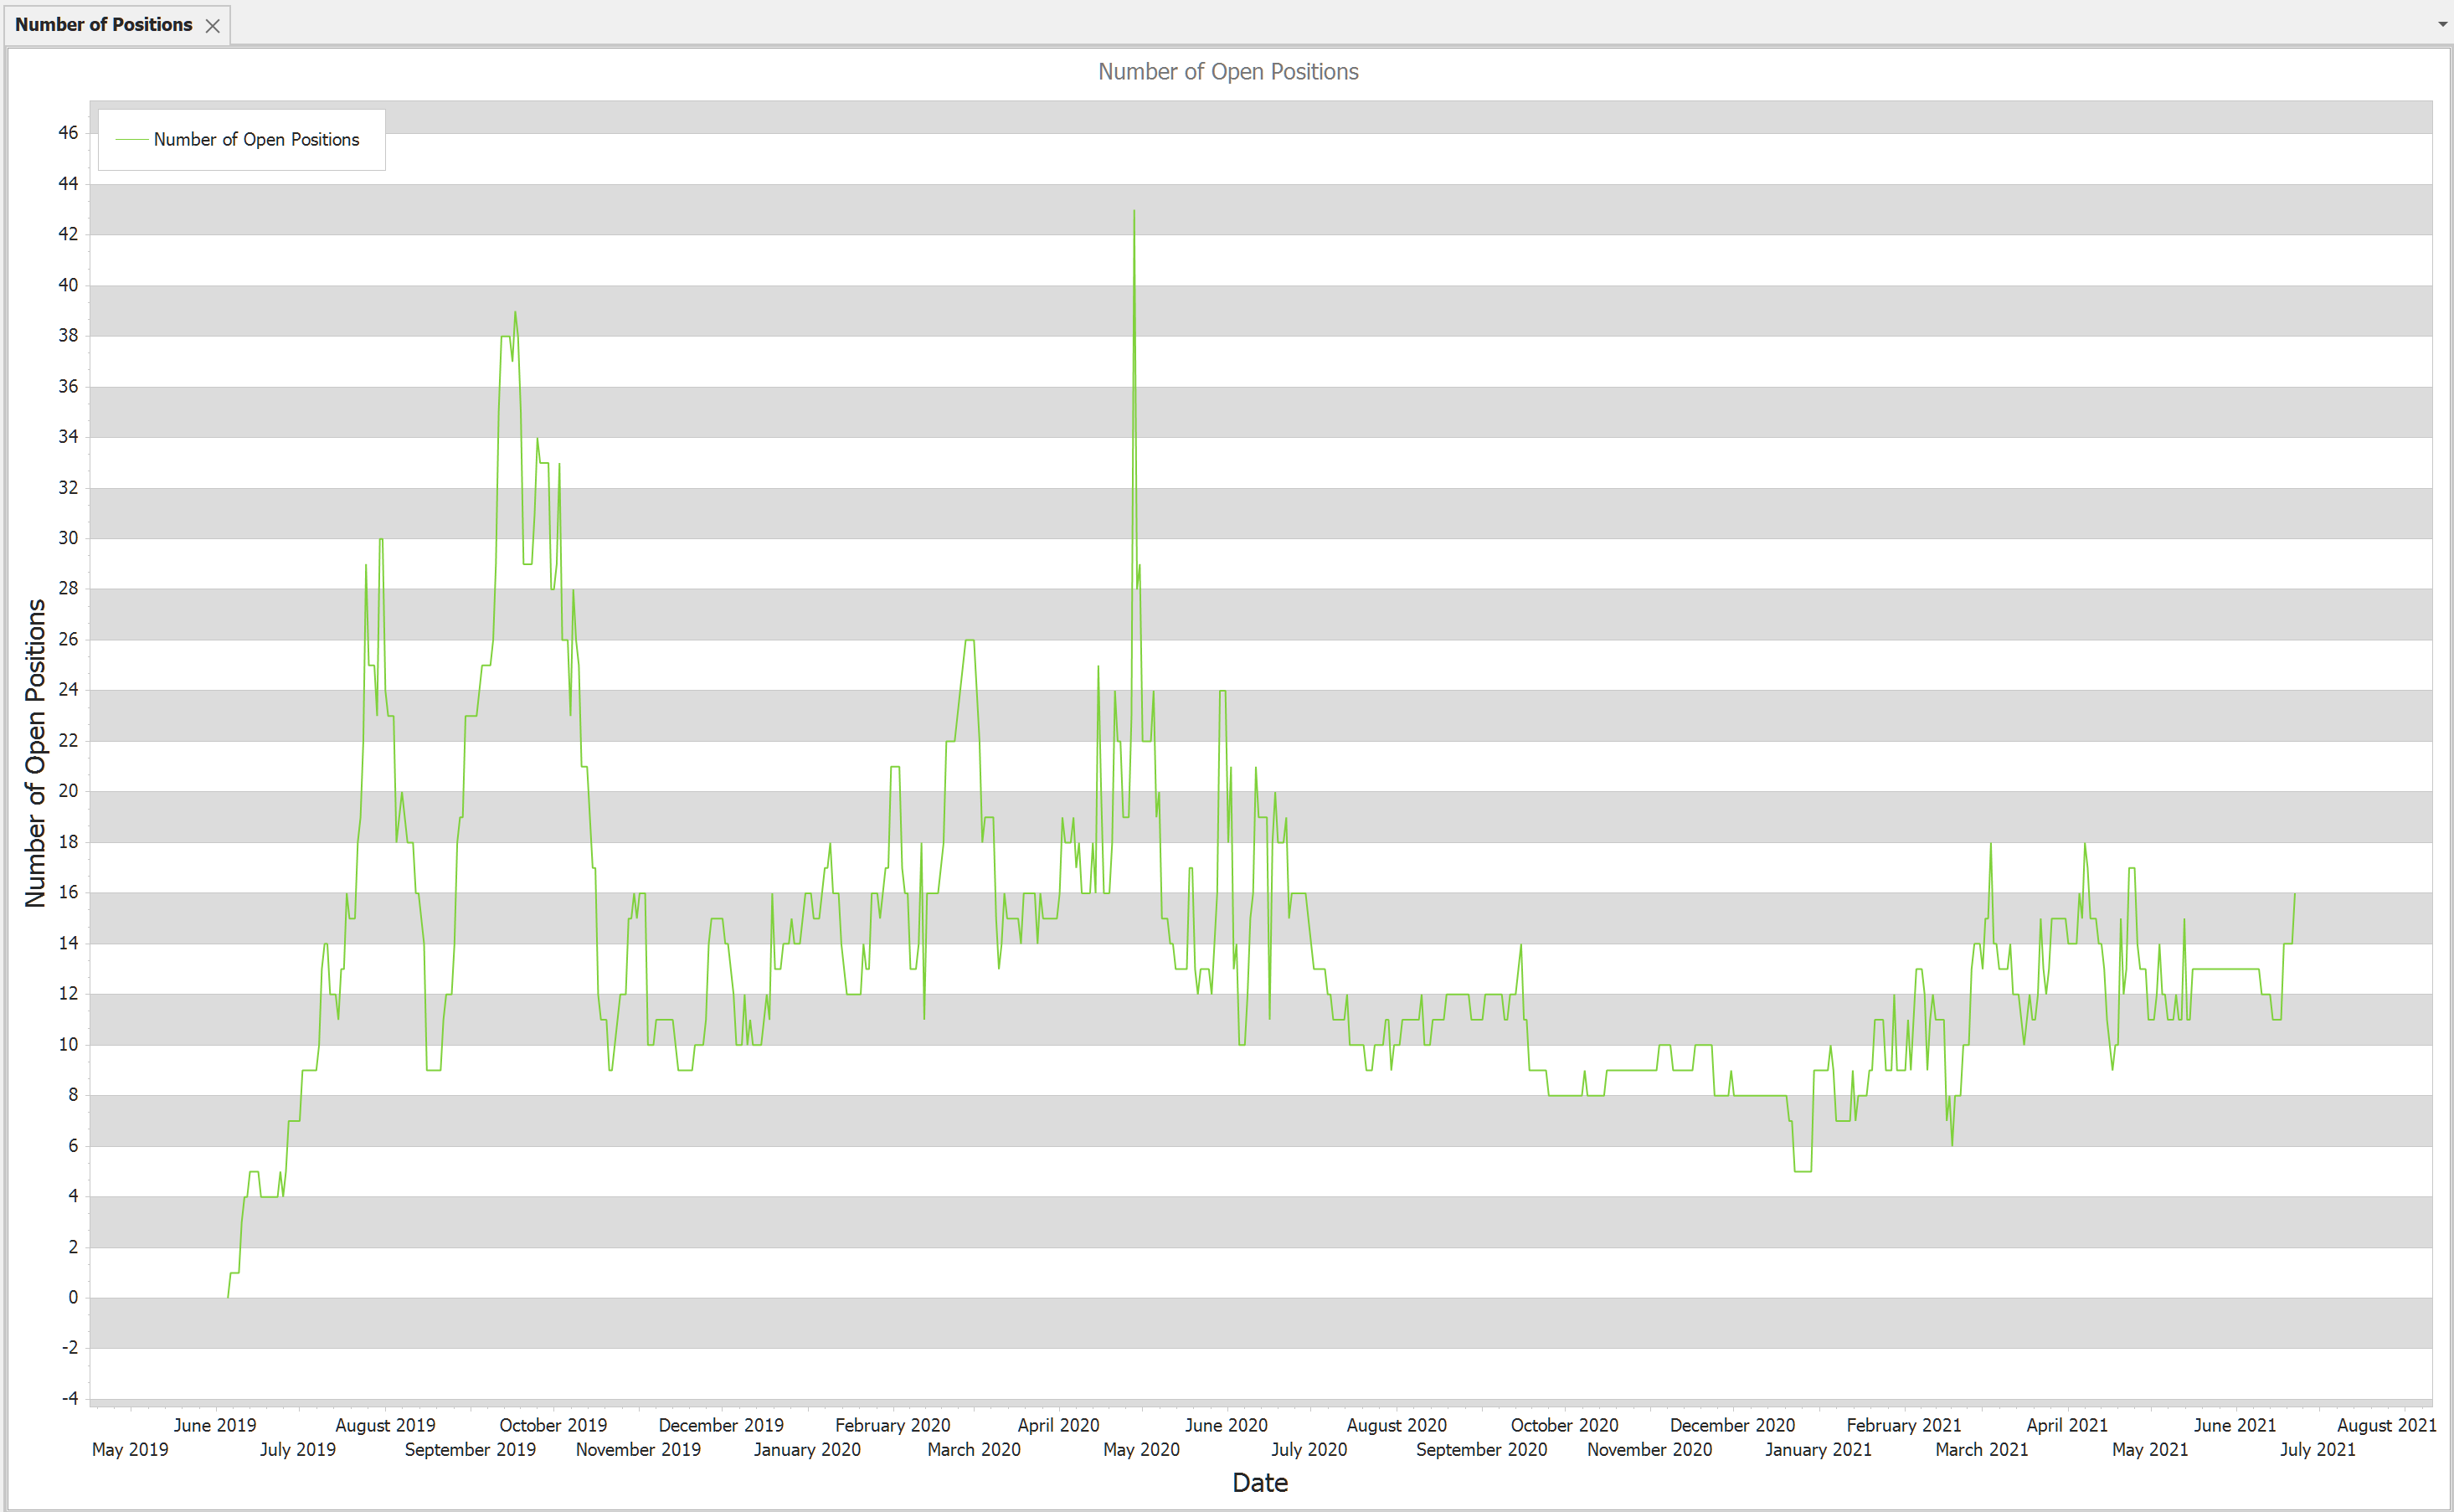
Number of Open Positions chart is a line chart which shows the open positions by the time.
X Axis: Date
Y Axis: How many position were opened at the given date

Context menus (right click on the chart):
• Print Preview
• Export To. You can export the report to different formats like HTML, Excel, Word or PDF
• Save Image As. Saves chart as image. Supported formats are: JPG, BMP, PNG
• Copy to clipboard
Setup
▪Plot area line - plot an area line instead of a standard line
•Transparency - value between 0 and 255. Zero means no transparency and 255 is the full transparency.
Available filters:
All filters are applied.
