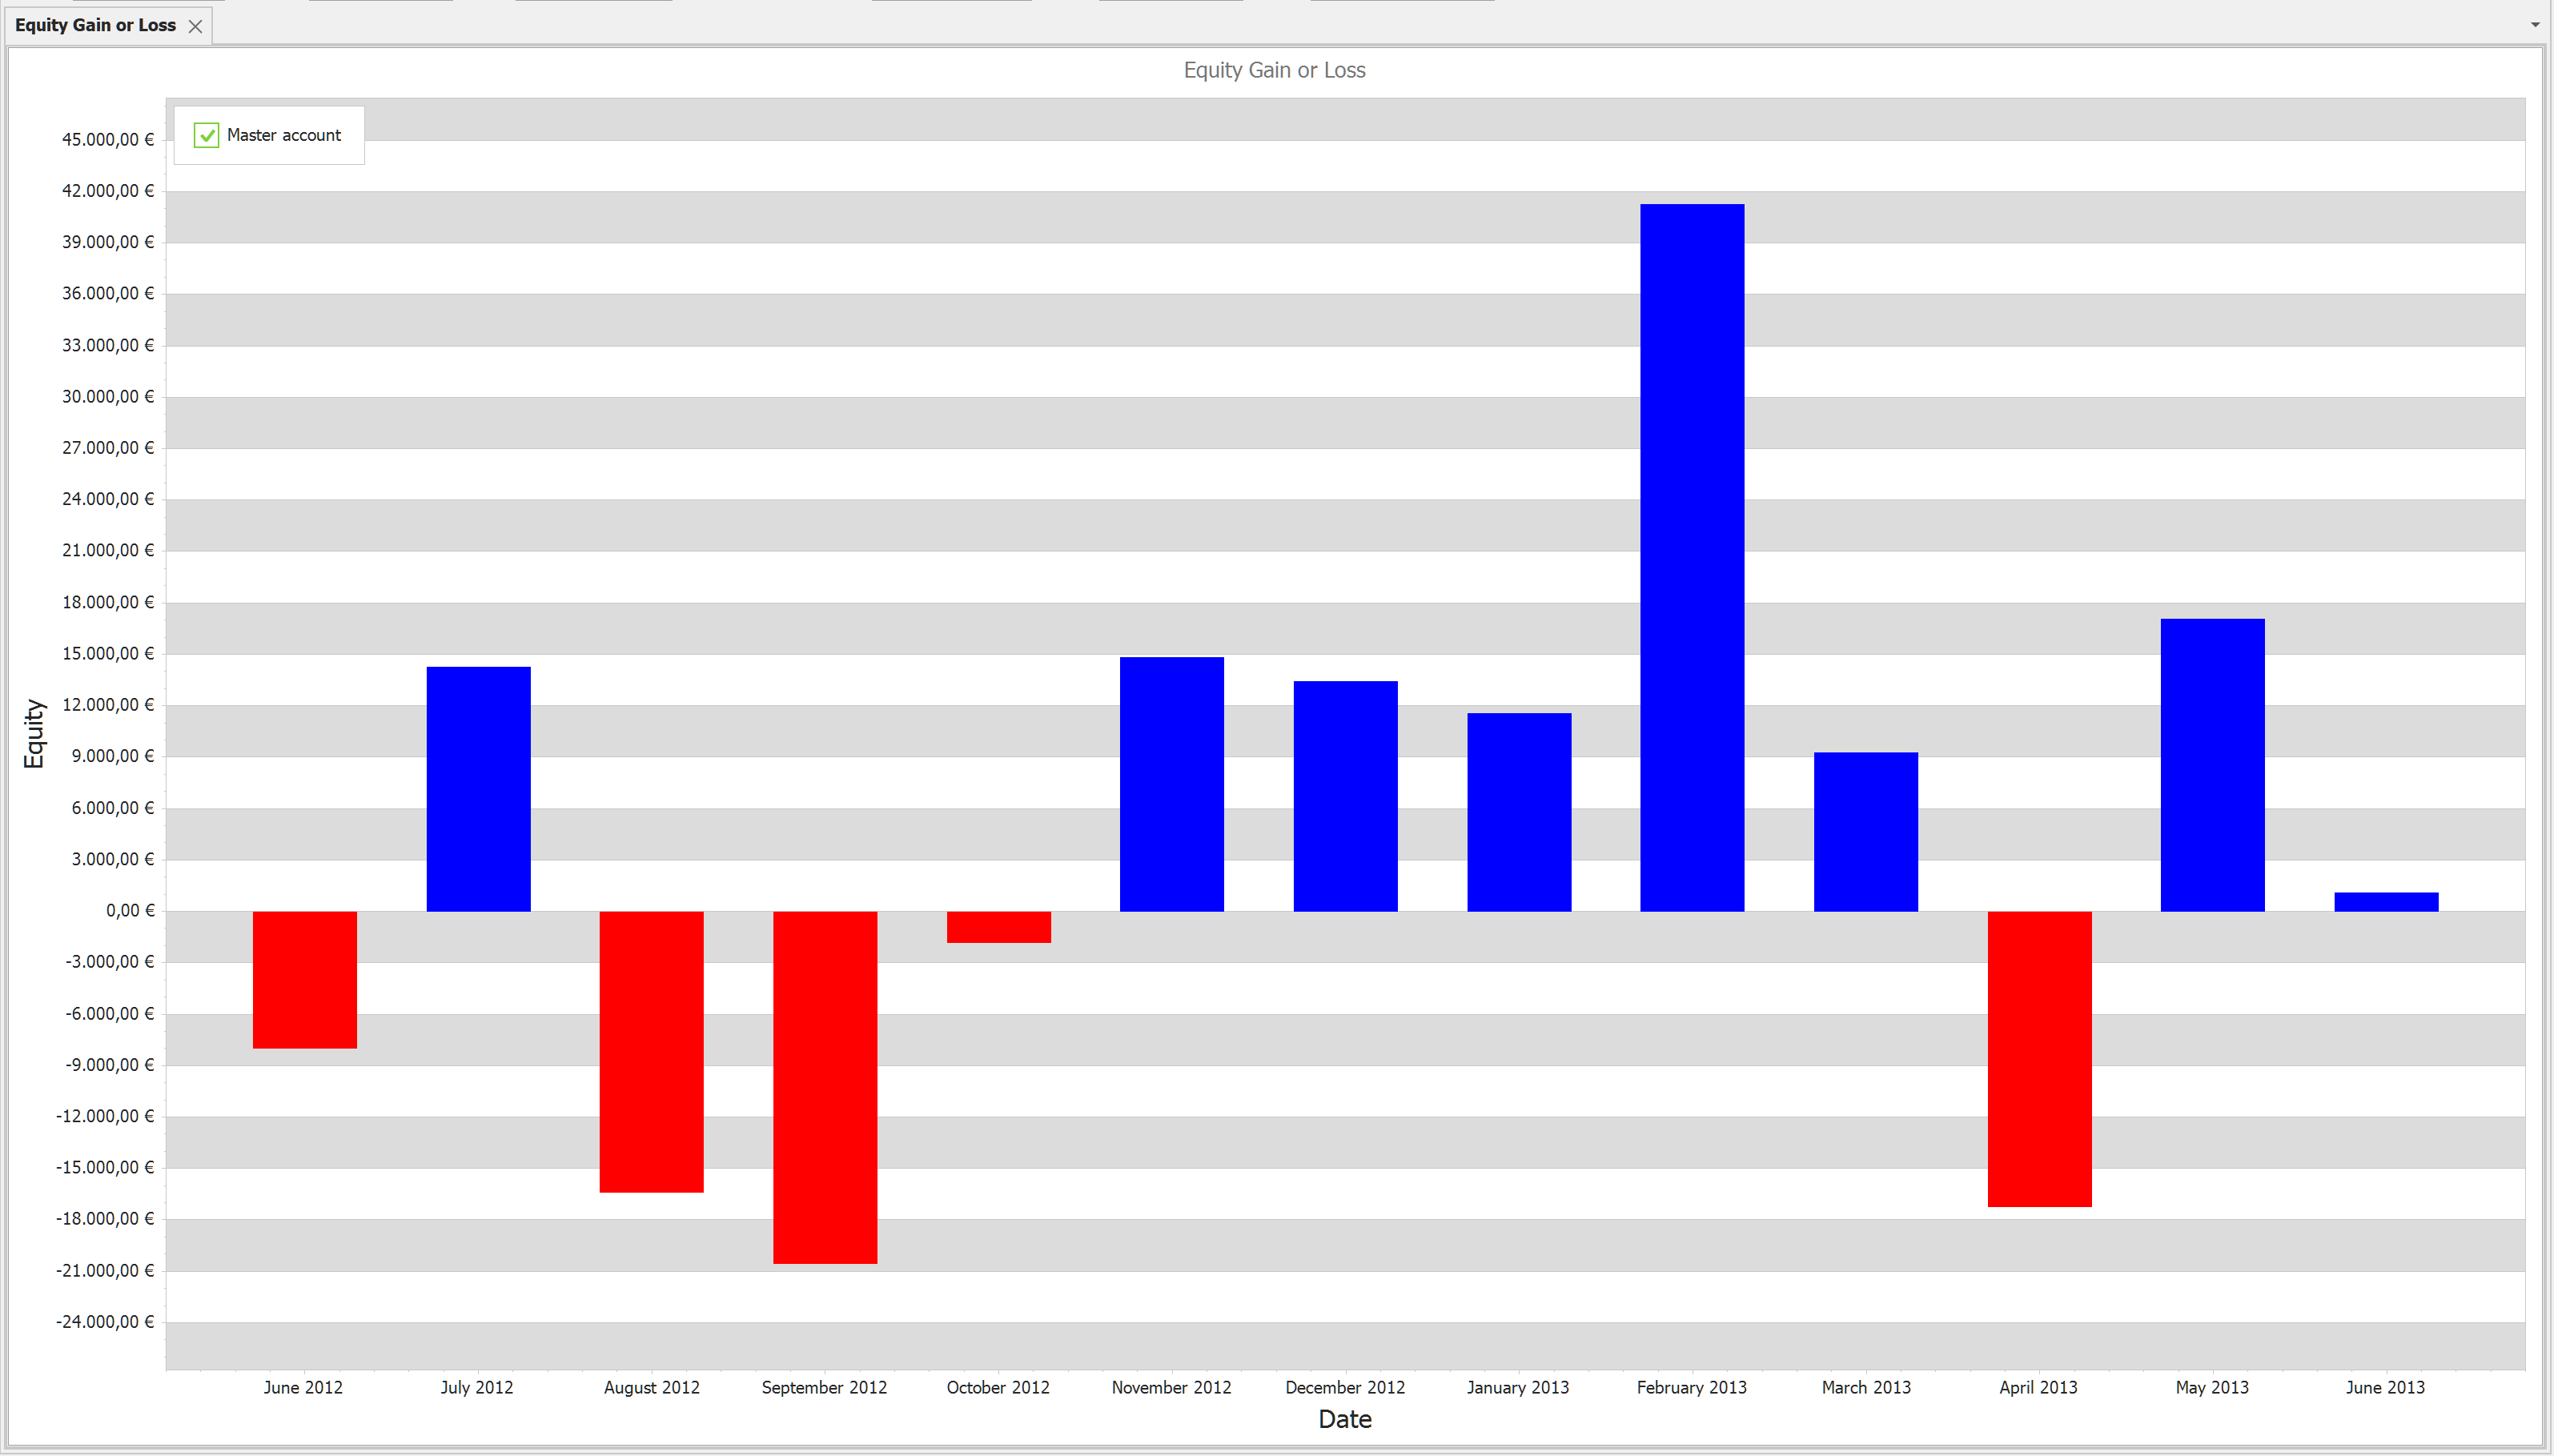
Equity Gain or Loss chart is a bar chart that shows the change between two dates based on the Total Equity list.
X Axis: Date
Y Axis: Change of equity value.
Context menus (right click on the chart):
• Print Preview
• Export To. You can export the report to different formats like HTML, Excel, Word or PDF
• Save Image As. Saves chart as image. Supported formats are: JPG, BMP, PNG
• Copy to clipboard
Settings
• Colors. you can change the Profit or Loss color or use the default values defined under the Options Look and Feel settings.
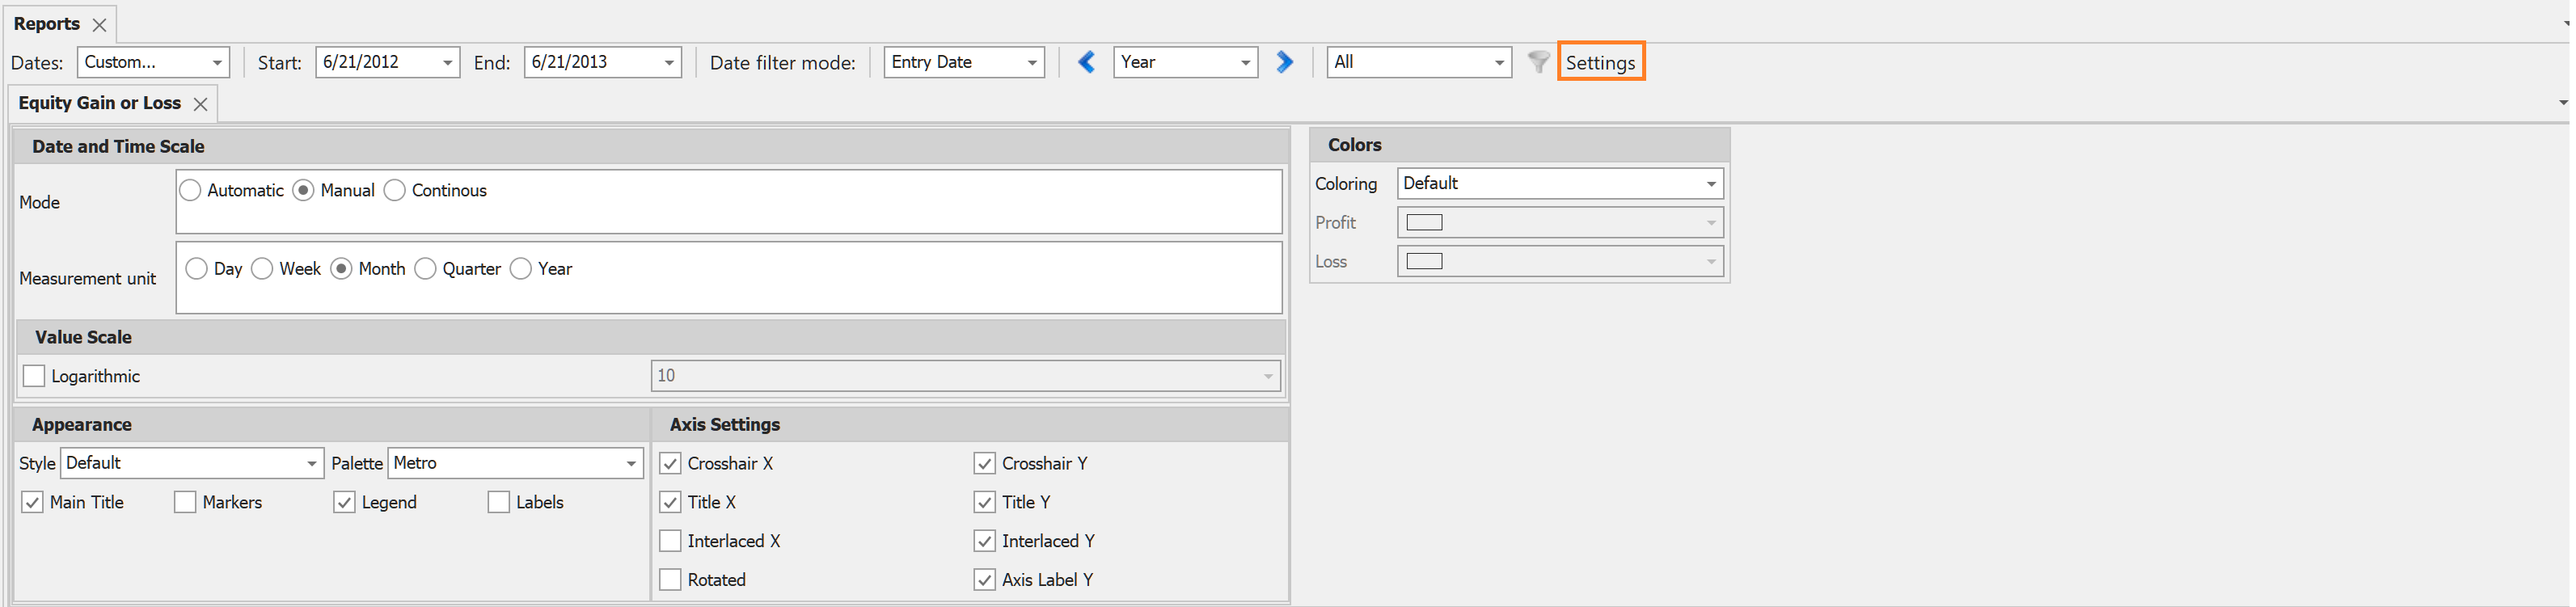
It is worth mentioning that from the common settings the Date and Time Scale, Measurement unit has an important role settings here. Changing the measurement unit changes the gain or loss measurement range.
Available filters:
Only date filters.