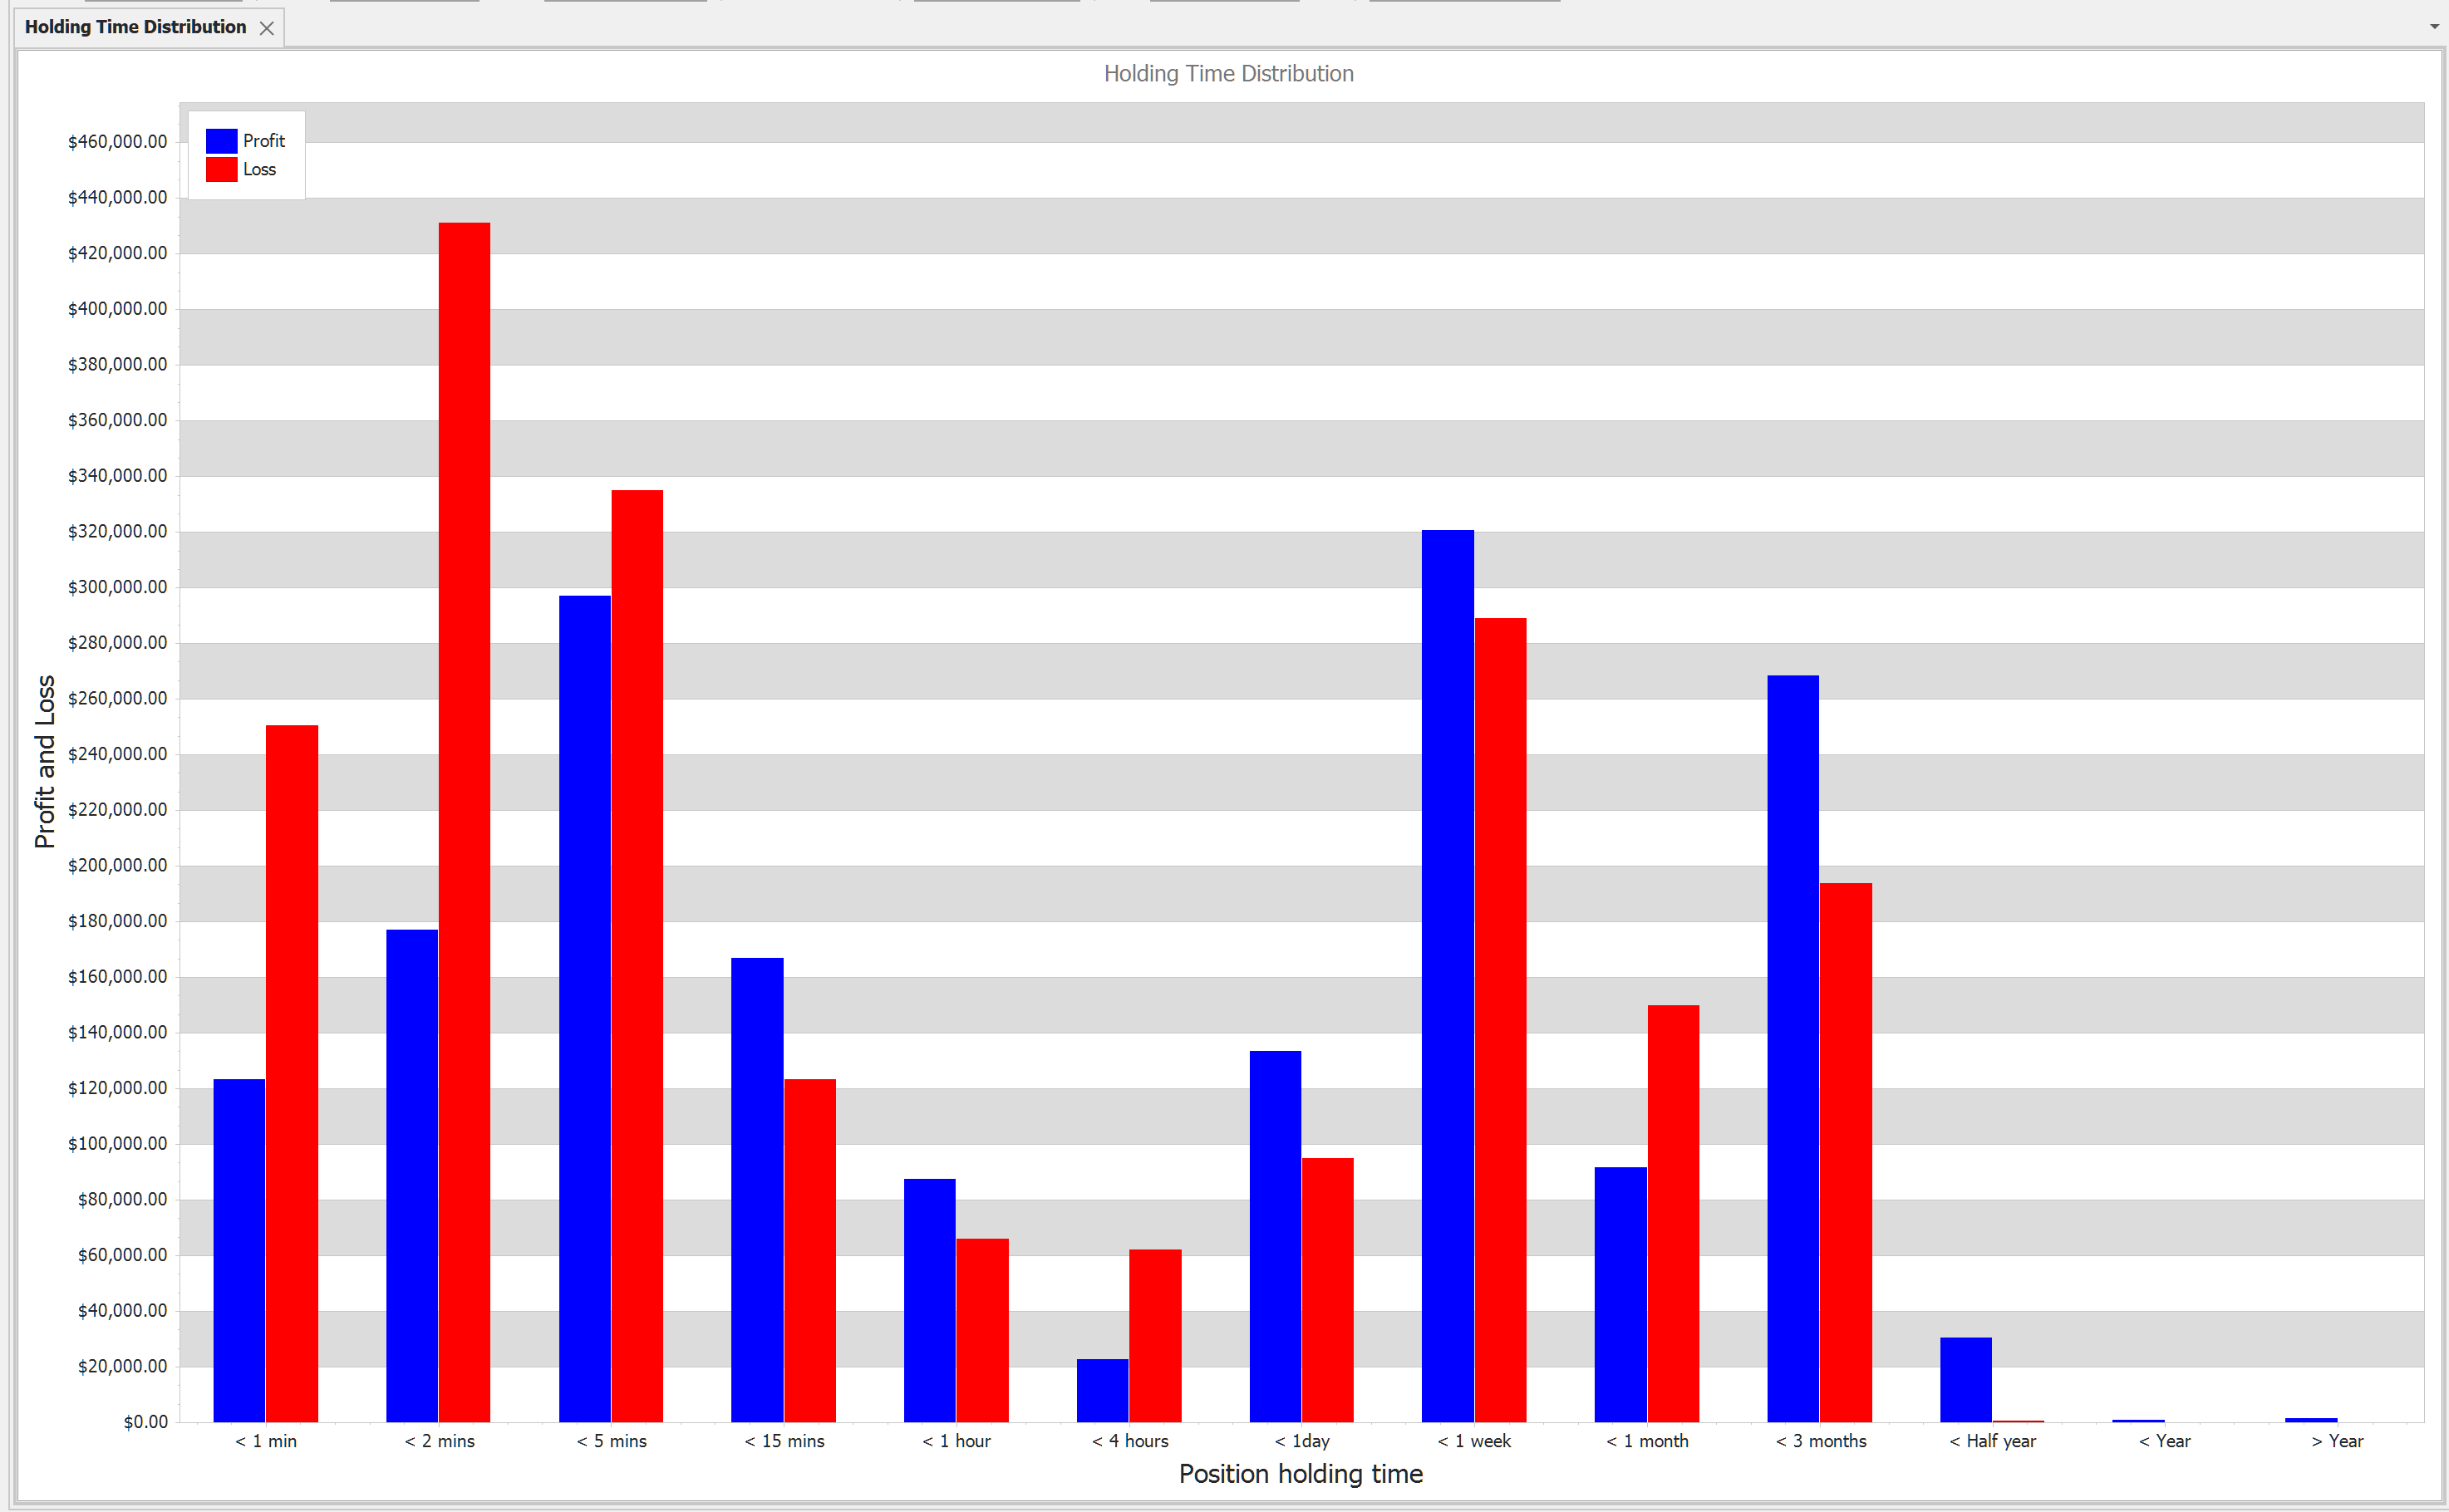
Holding Time Distribution chart is a distribution bar chart based on positions holding time.
The X axis shows the holding time and the Y axis shows the number of the positions. The winning positions are colored with the Win Color (default is blue) and the losing positions are colored with the Lose Color (default is red).
X Axis: Holding Time
Y Axis: Profit and Loss or number of positions based in the settings
Context menus (right click on the chart):
• Print Preview
• Export To. You can export the report to different formats like HTML, Excel, Word or PDF
• Save Image As. Saves chart as image. Supported formats are: JPG, BMP, PNG
• Copy to clipboard
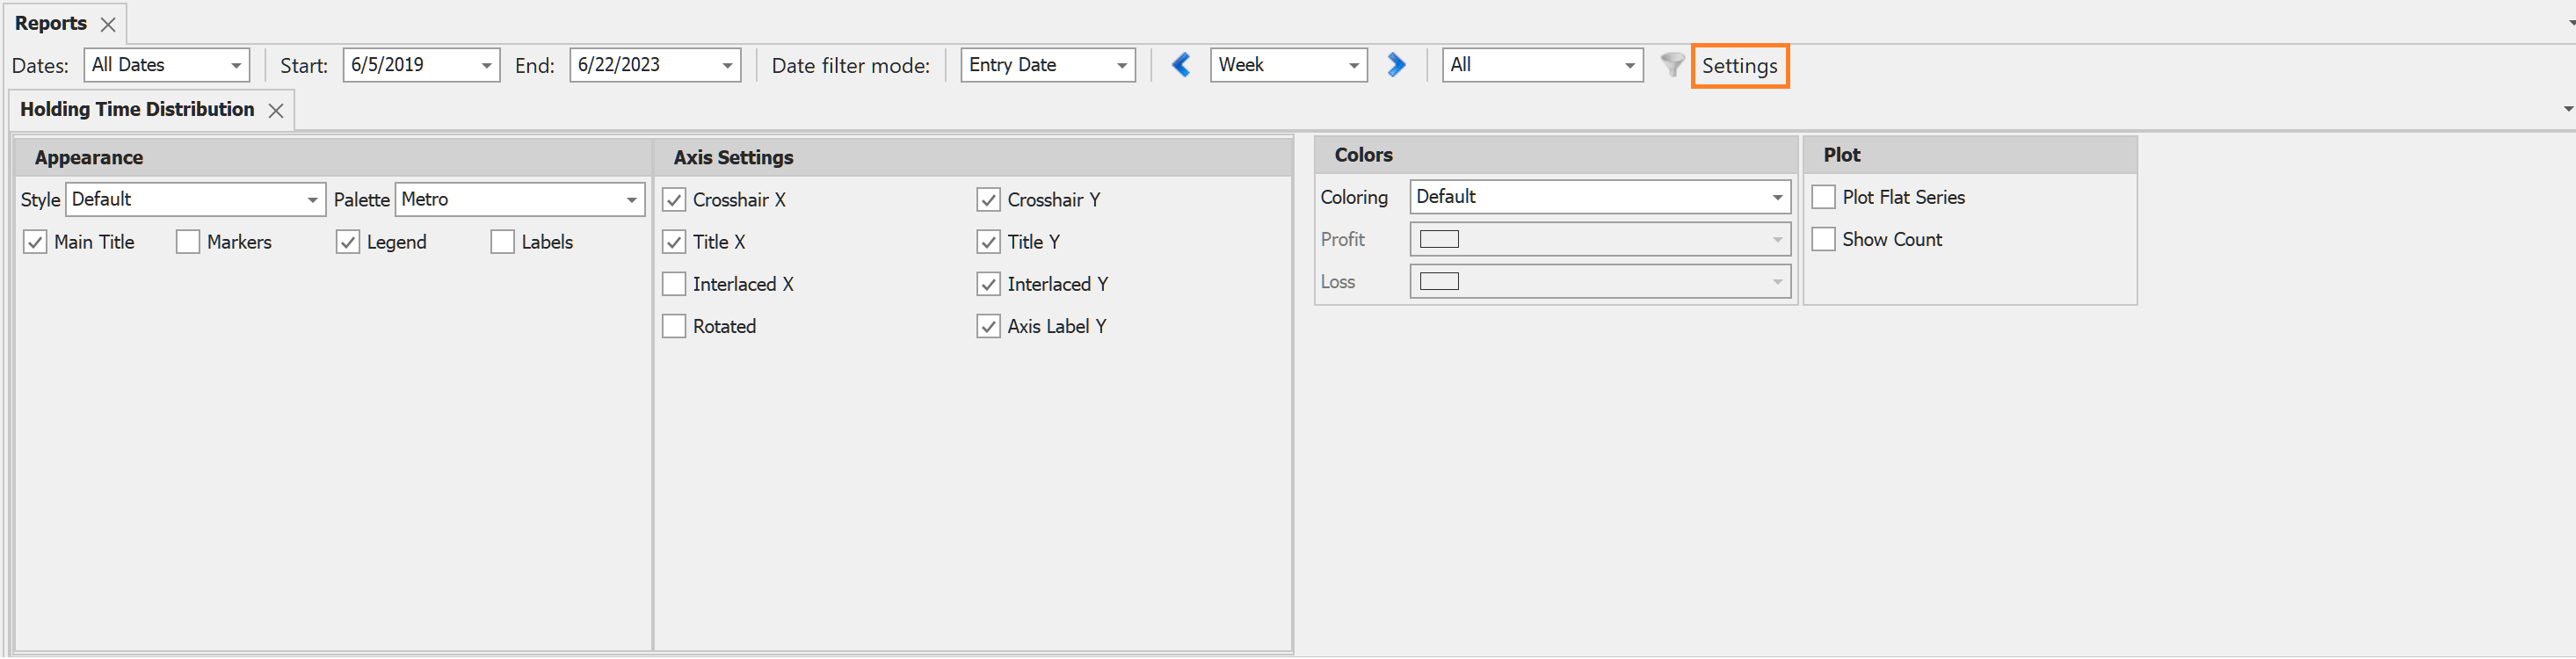
Settings (click on the settings button on the filter tool strip):
oColors
oPlot
▪Plot flat series
▪Show count. Show the number of trades instead of the P&L.
Available filters:
All filters are available.