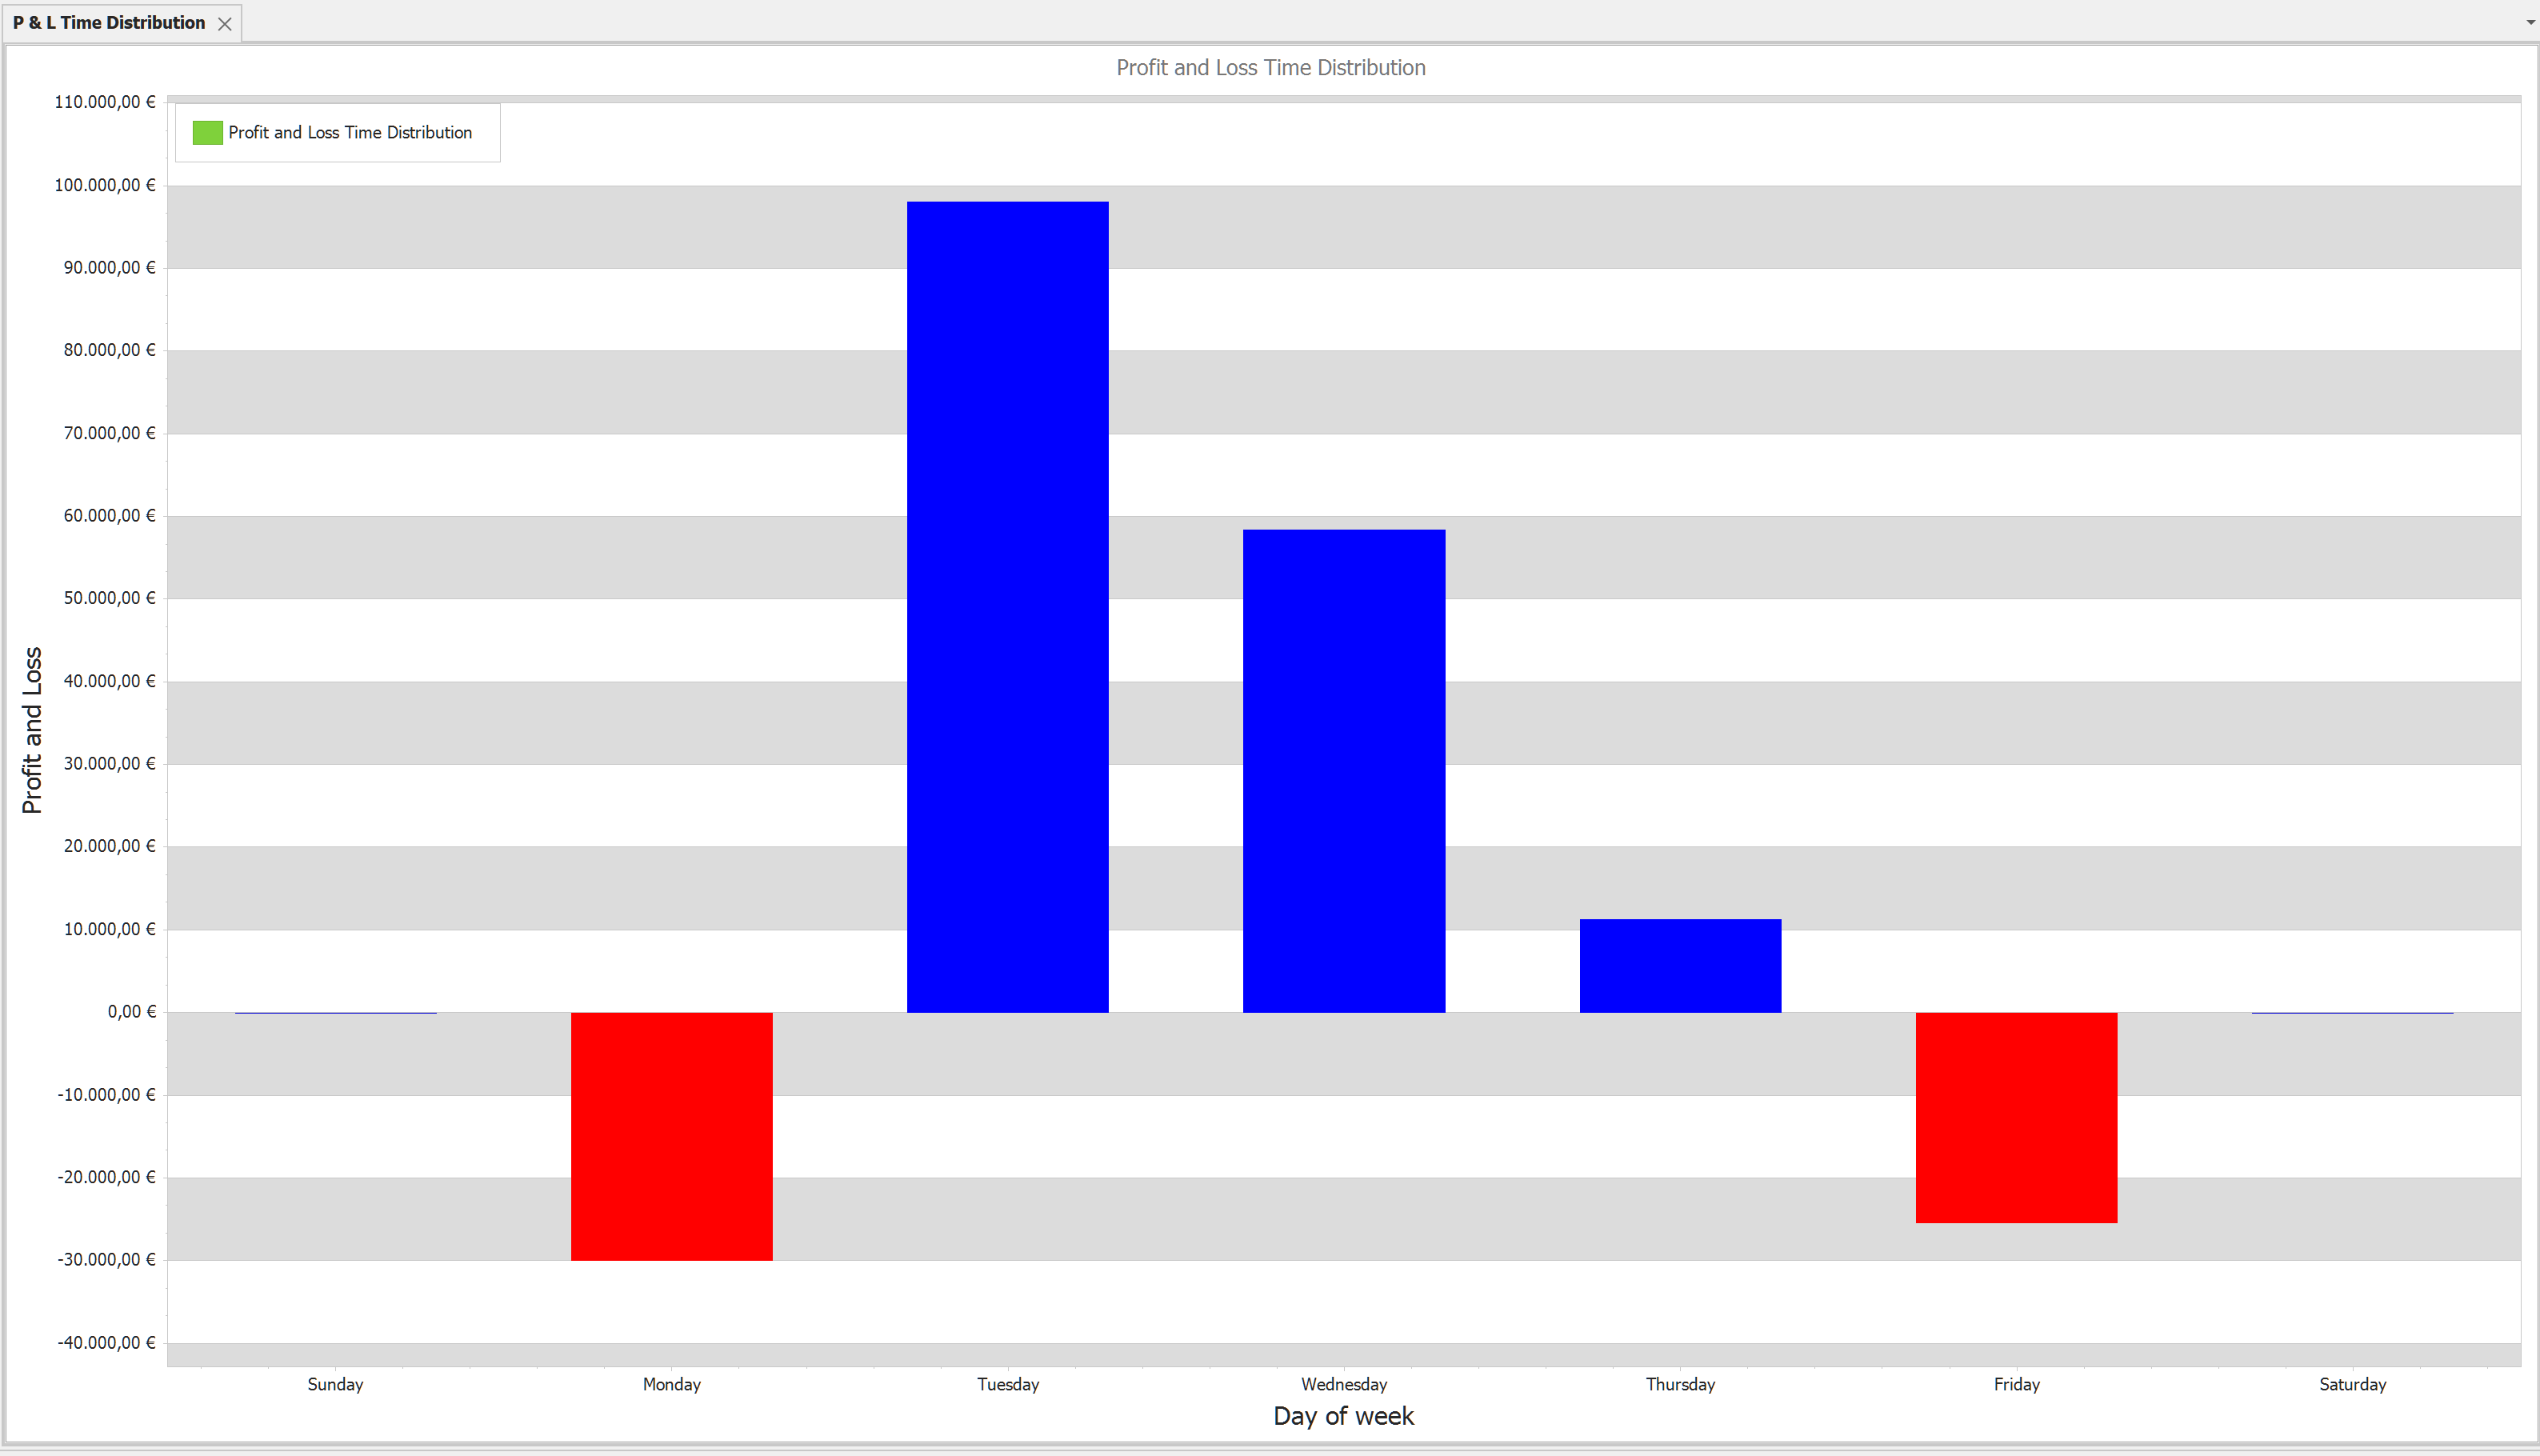
Profit & Loss Time Distribution is a bar chart which shows the P&L distribution by time.
With this chart you can analyse which hours, days, months are profitable for you and which are not.
X Axis: Date/Month or time
Y Axis: Profit and Loss
Context menus (right click on the chart):
• Print Preview
• Export To. You can export the report to different formats like HTML, Excel, Word or PDF
• Save Image As. Saves chart as image. Supported formats are: JPG, BMP, PNG
• Copy to clipboard
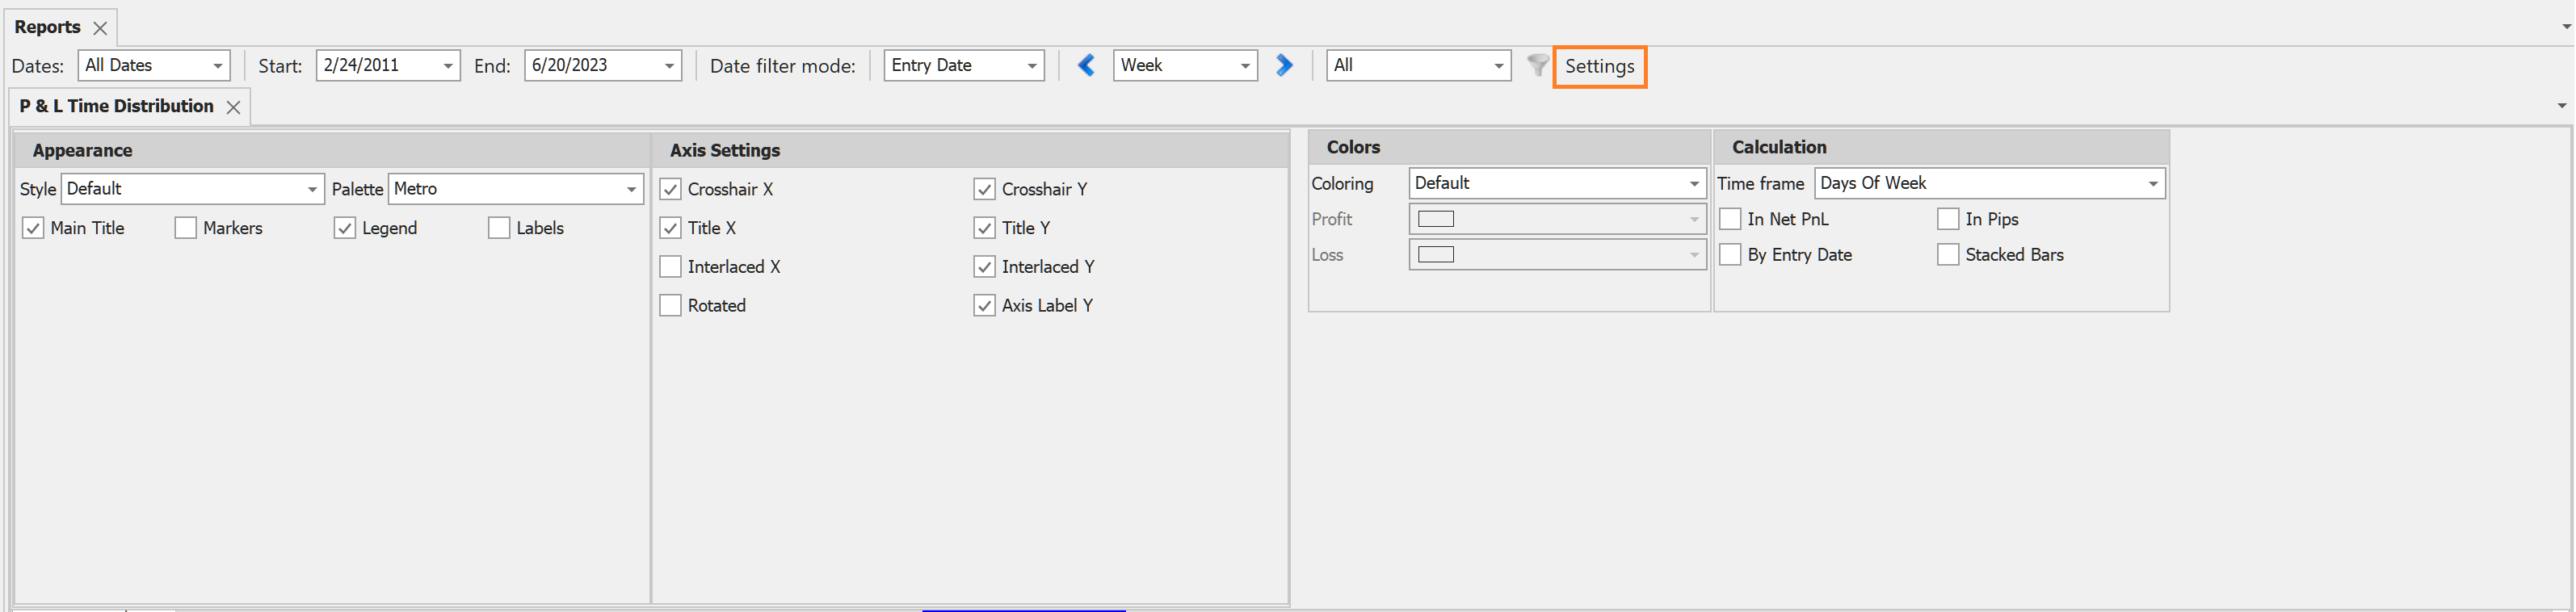
Settings
• Colors. you can change the Profit or Loss color or use the default values defined under the Options Look and Feel settings.
• Calculation
oTime frame. There are four different time frames which can be set:
▪Hourly - There are 24 bars and each bar shows the realized profit on an hour basis
▪Week days - There are 5 bars from Monday to Friday and each bar shows the realized profit for the given day of the week
▪Month days - There are 31 bars and each bar shows the realized profit for the given day of the month
▪Months of a year - There 12 bars from January to December and each bar shows the realized profit for the given month of the year.
oIn Net PnL. Displays the Net PnL values instead of the PnL.
oBy Entry Date. The date time axis will show the entry date of the position instead of the exit date.
oStacked Bars. Stacked bars displays the percentage of the Profit vs Loss.
oIn Pips. Shows the values in pips instead of in the base currency.
Available filters:
All filters are available.