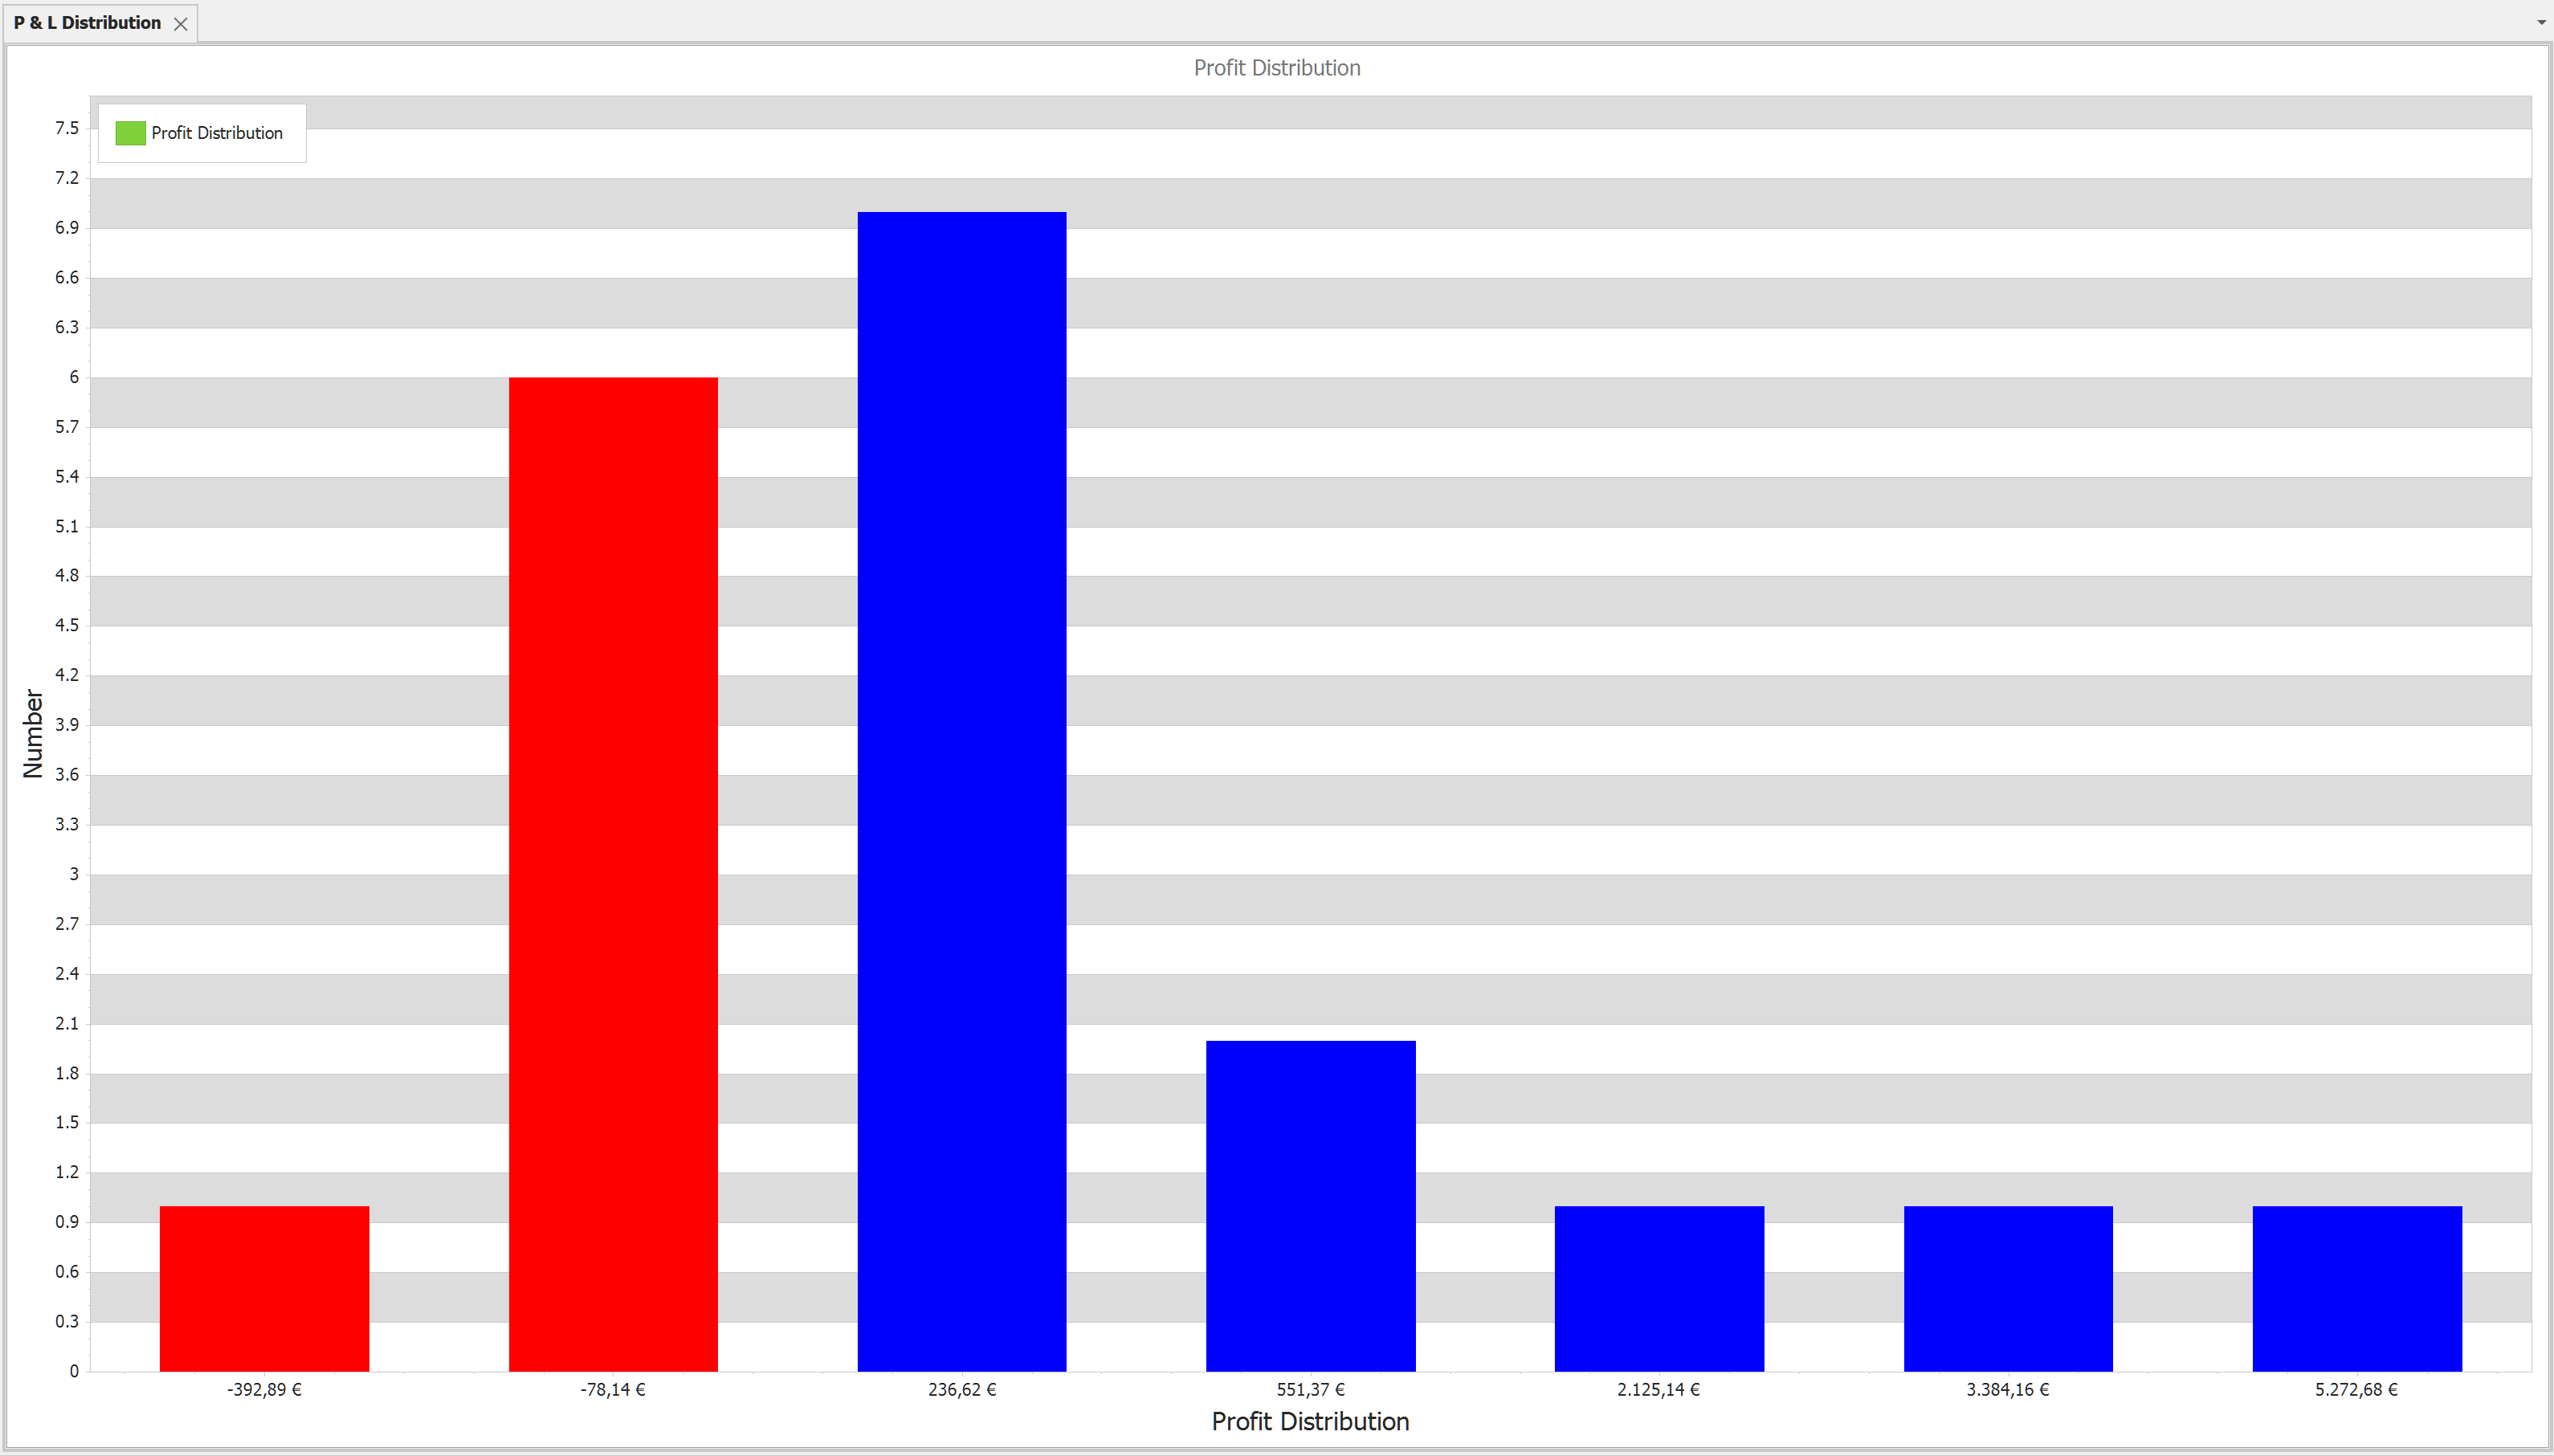
Profit & Loss Distribution chart is based on the realized P&L. The chart is divided up to 20 bars according to the realized profits. Each bar shows the number of how many realized P&Ls fall into the range.
X Axis: The number of how many trades fall into a particular range.
Y Axis: PnL. Middle of the range
Context menus (right click on the chart):
• Print preview
• Export to different document formats
• Save Image As. Saving chart as image. Supported formats are: PDF, JPG, BMP, PNG
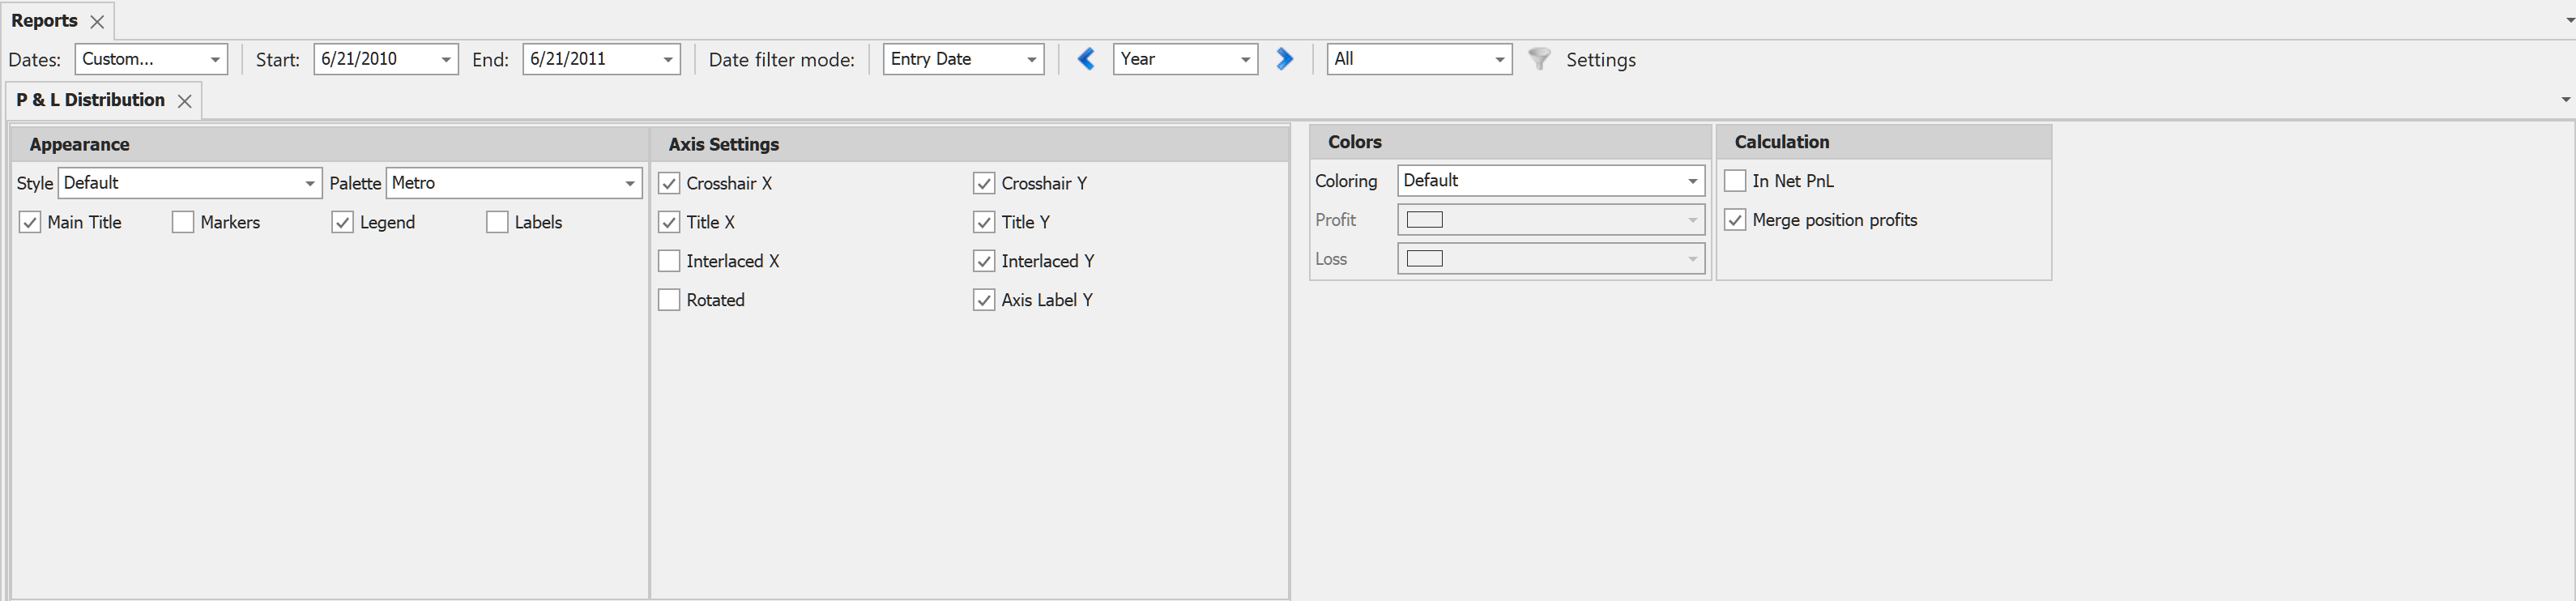
Settings
• Colors. you can change the Profit or Loss color or use the default values defined under the Options Look and Feel settings.
• Calculation
oIn Net PnL. Displays the Net PnL values instead of the PnL.
oMerge position profits. By default each executions are separated into a single profit element. Ticking the merge position profits each positions` profit will be one element.
Available filters:
All filters are available.