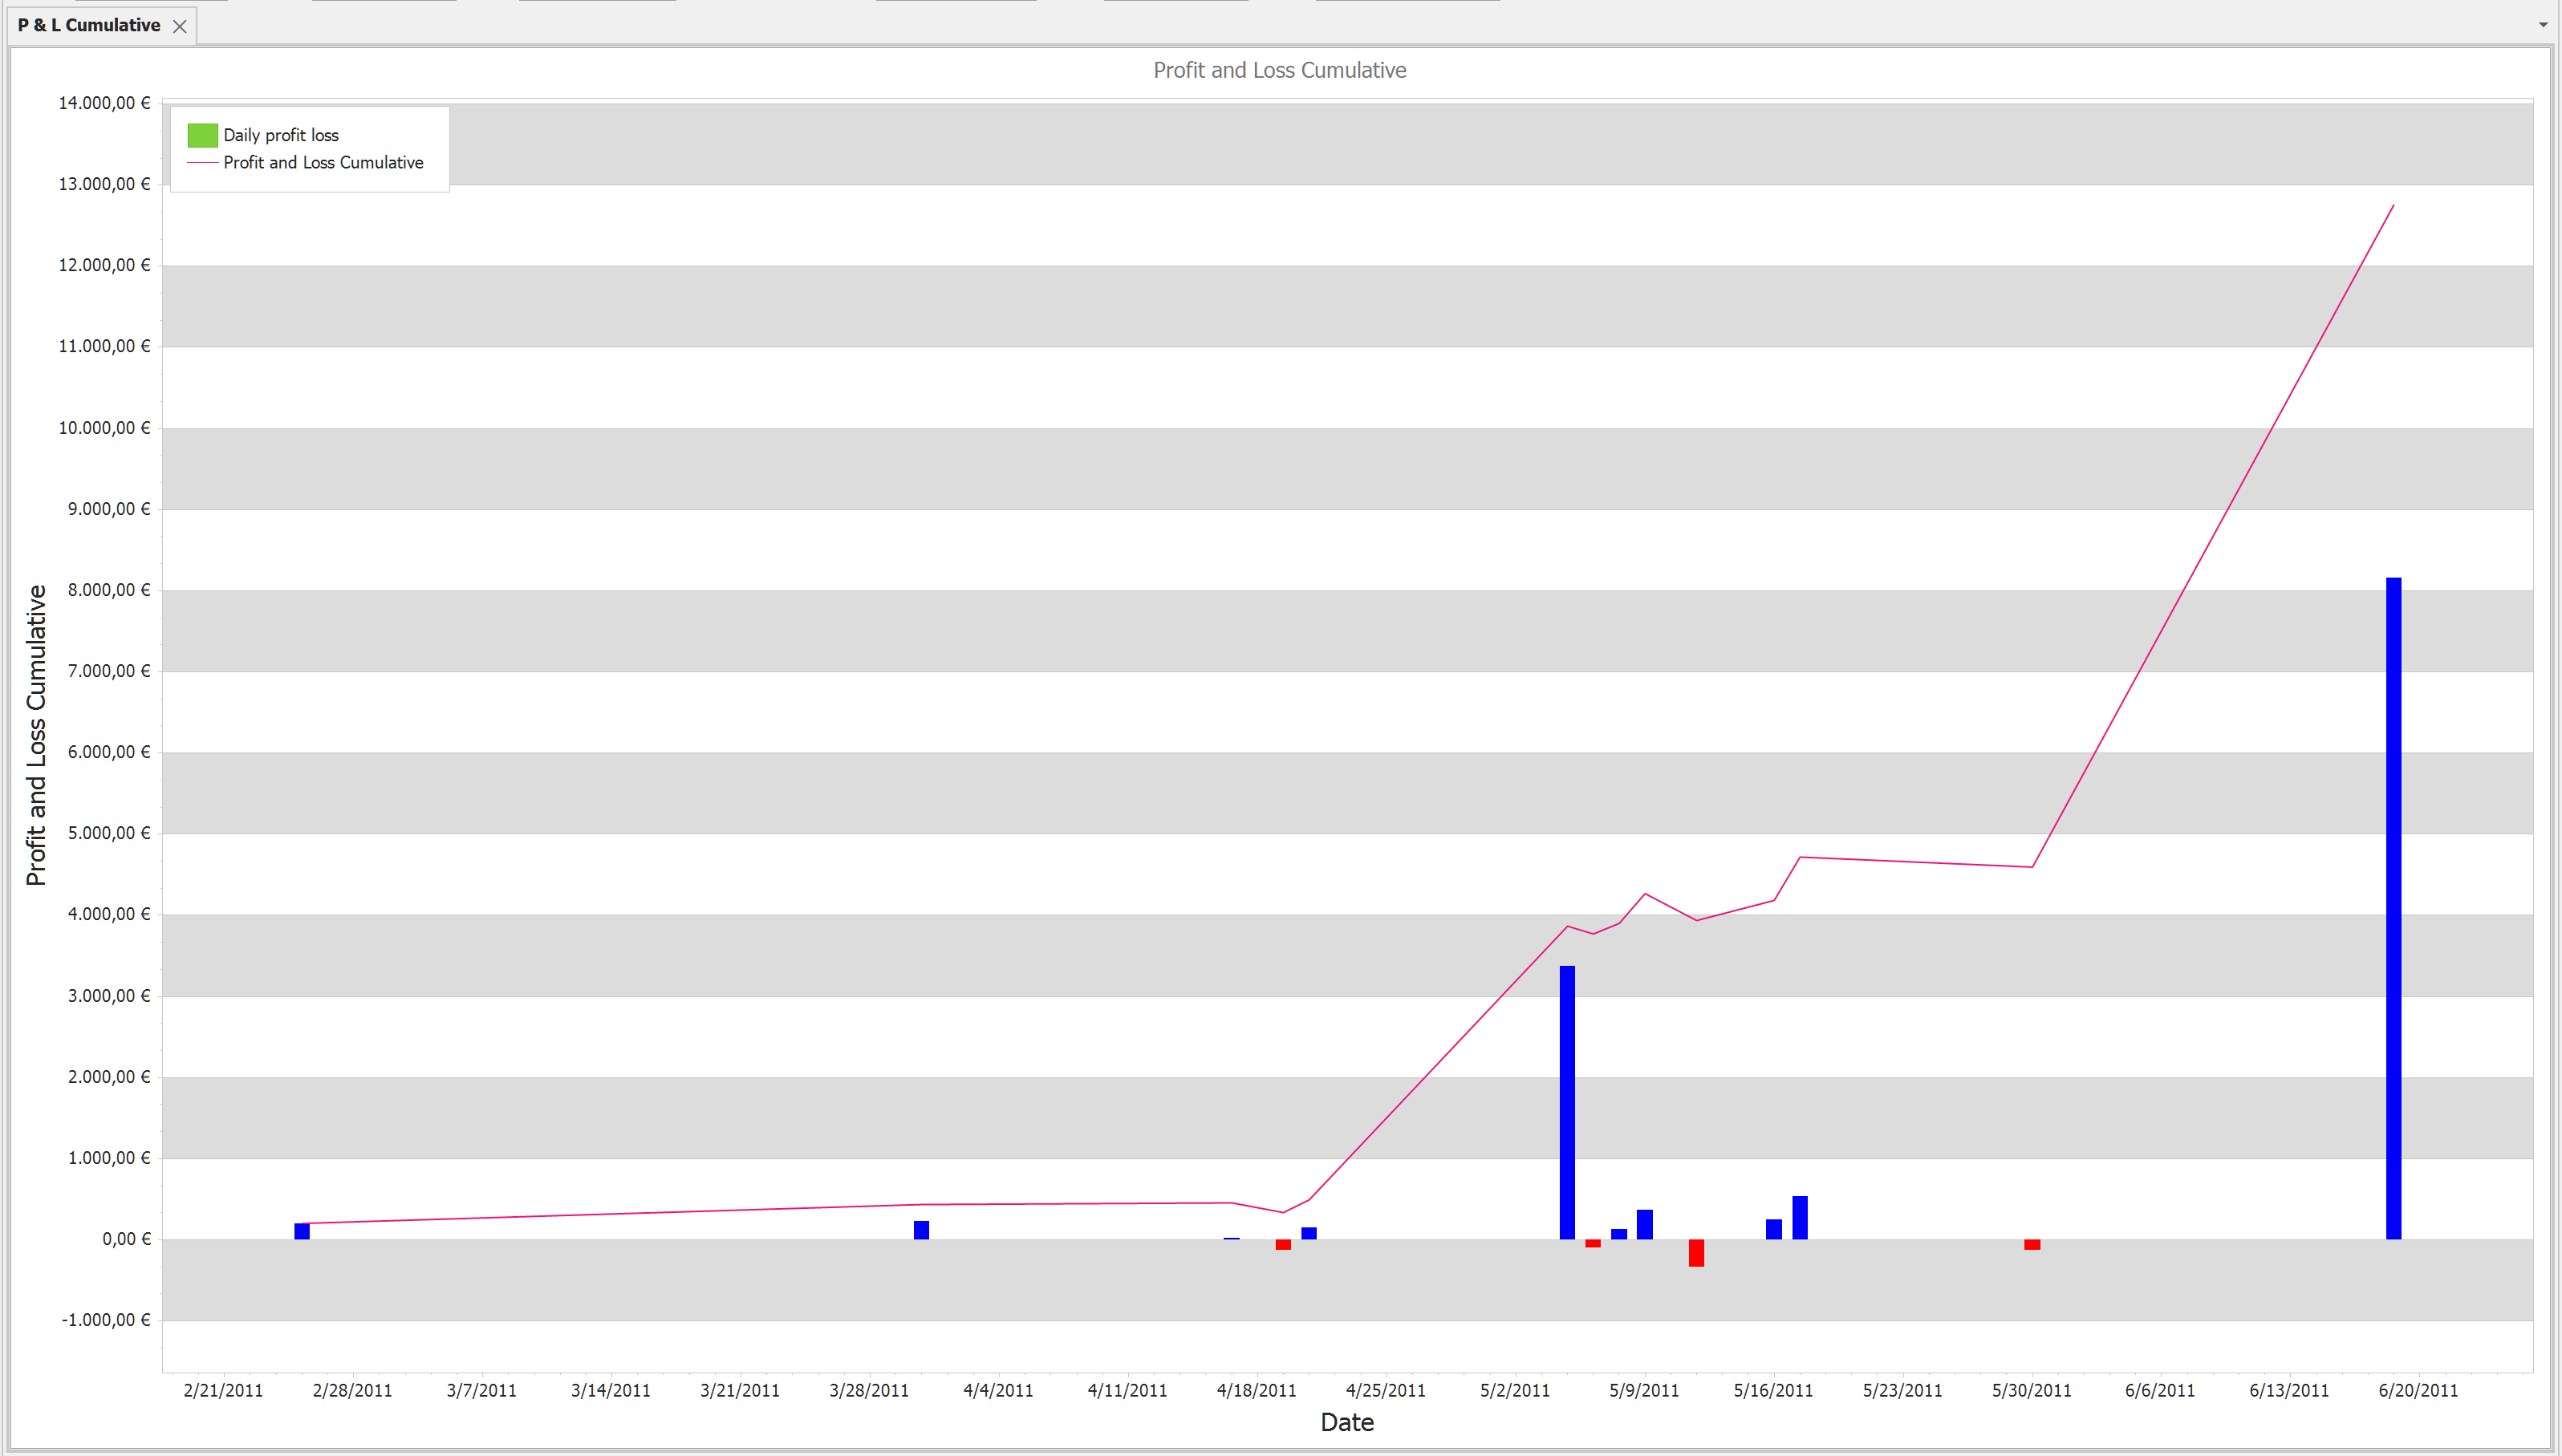
Profit & Loss Cumulative chart is based on the realized P&L. The chart has two elements:
• a line chart which shows the P&L cumulative value
• a bar chart which shows the realized P&L sum for a date period set by the resolution value.
X Axis: Date
Y Axis: Profit and Loss
Context menus (right click on the chart):
• Print Preview
• Export To. You can export the report to different formats like HTML, Excel, Word or PDF
• Save Image As. Saves chart as image. Supported formats are: JPG, BMP, PNG
• Copy to clipboard
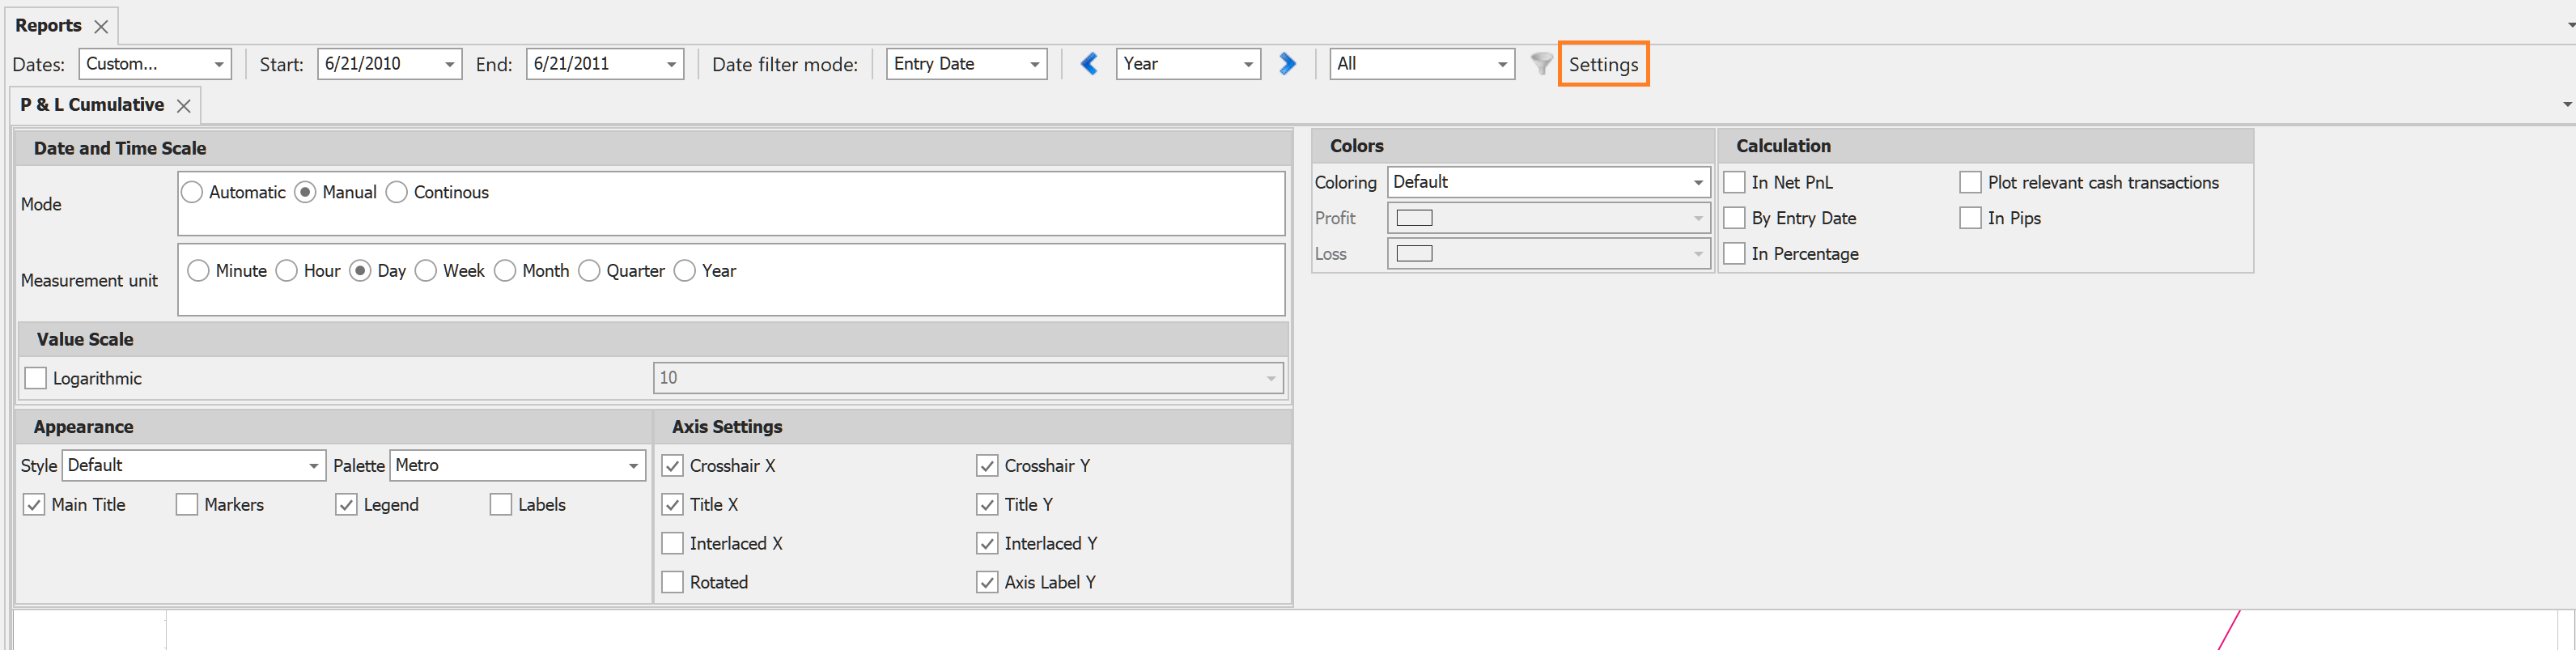
Settings
• Colors. you can change the Profit or Loss color or use the default values defined under the Options Look and Feel settings.
• Calculation
oIn Net PnL. Displays the Net PnL values instead of the PnL.
oBy Entry Date. The date time axis will show the entry date of the position instead of the exit date.
oIn percentage. Shows the values in percentage to the total
oPlot relevant cash transactions. The bound to position cash transactions are shown in report.
oIn Pips. Shows the values in pips instead of in the base currency.
Available filters:
All filters are applied.