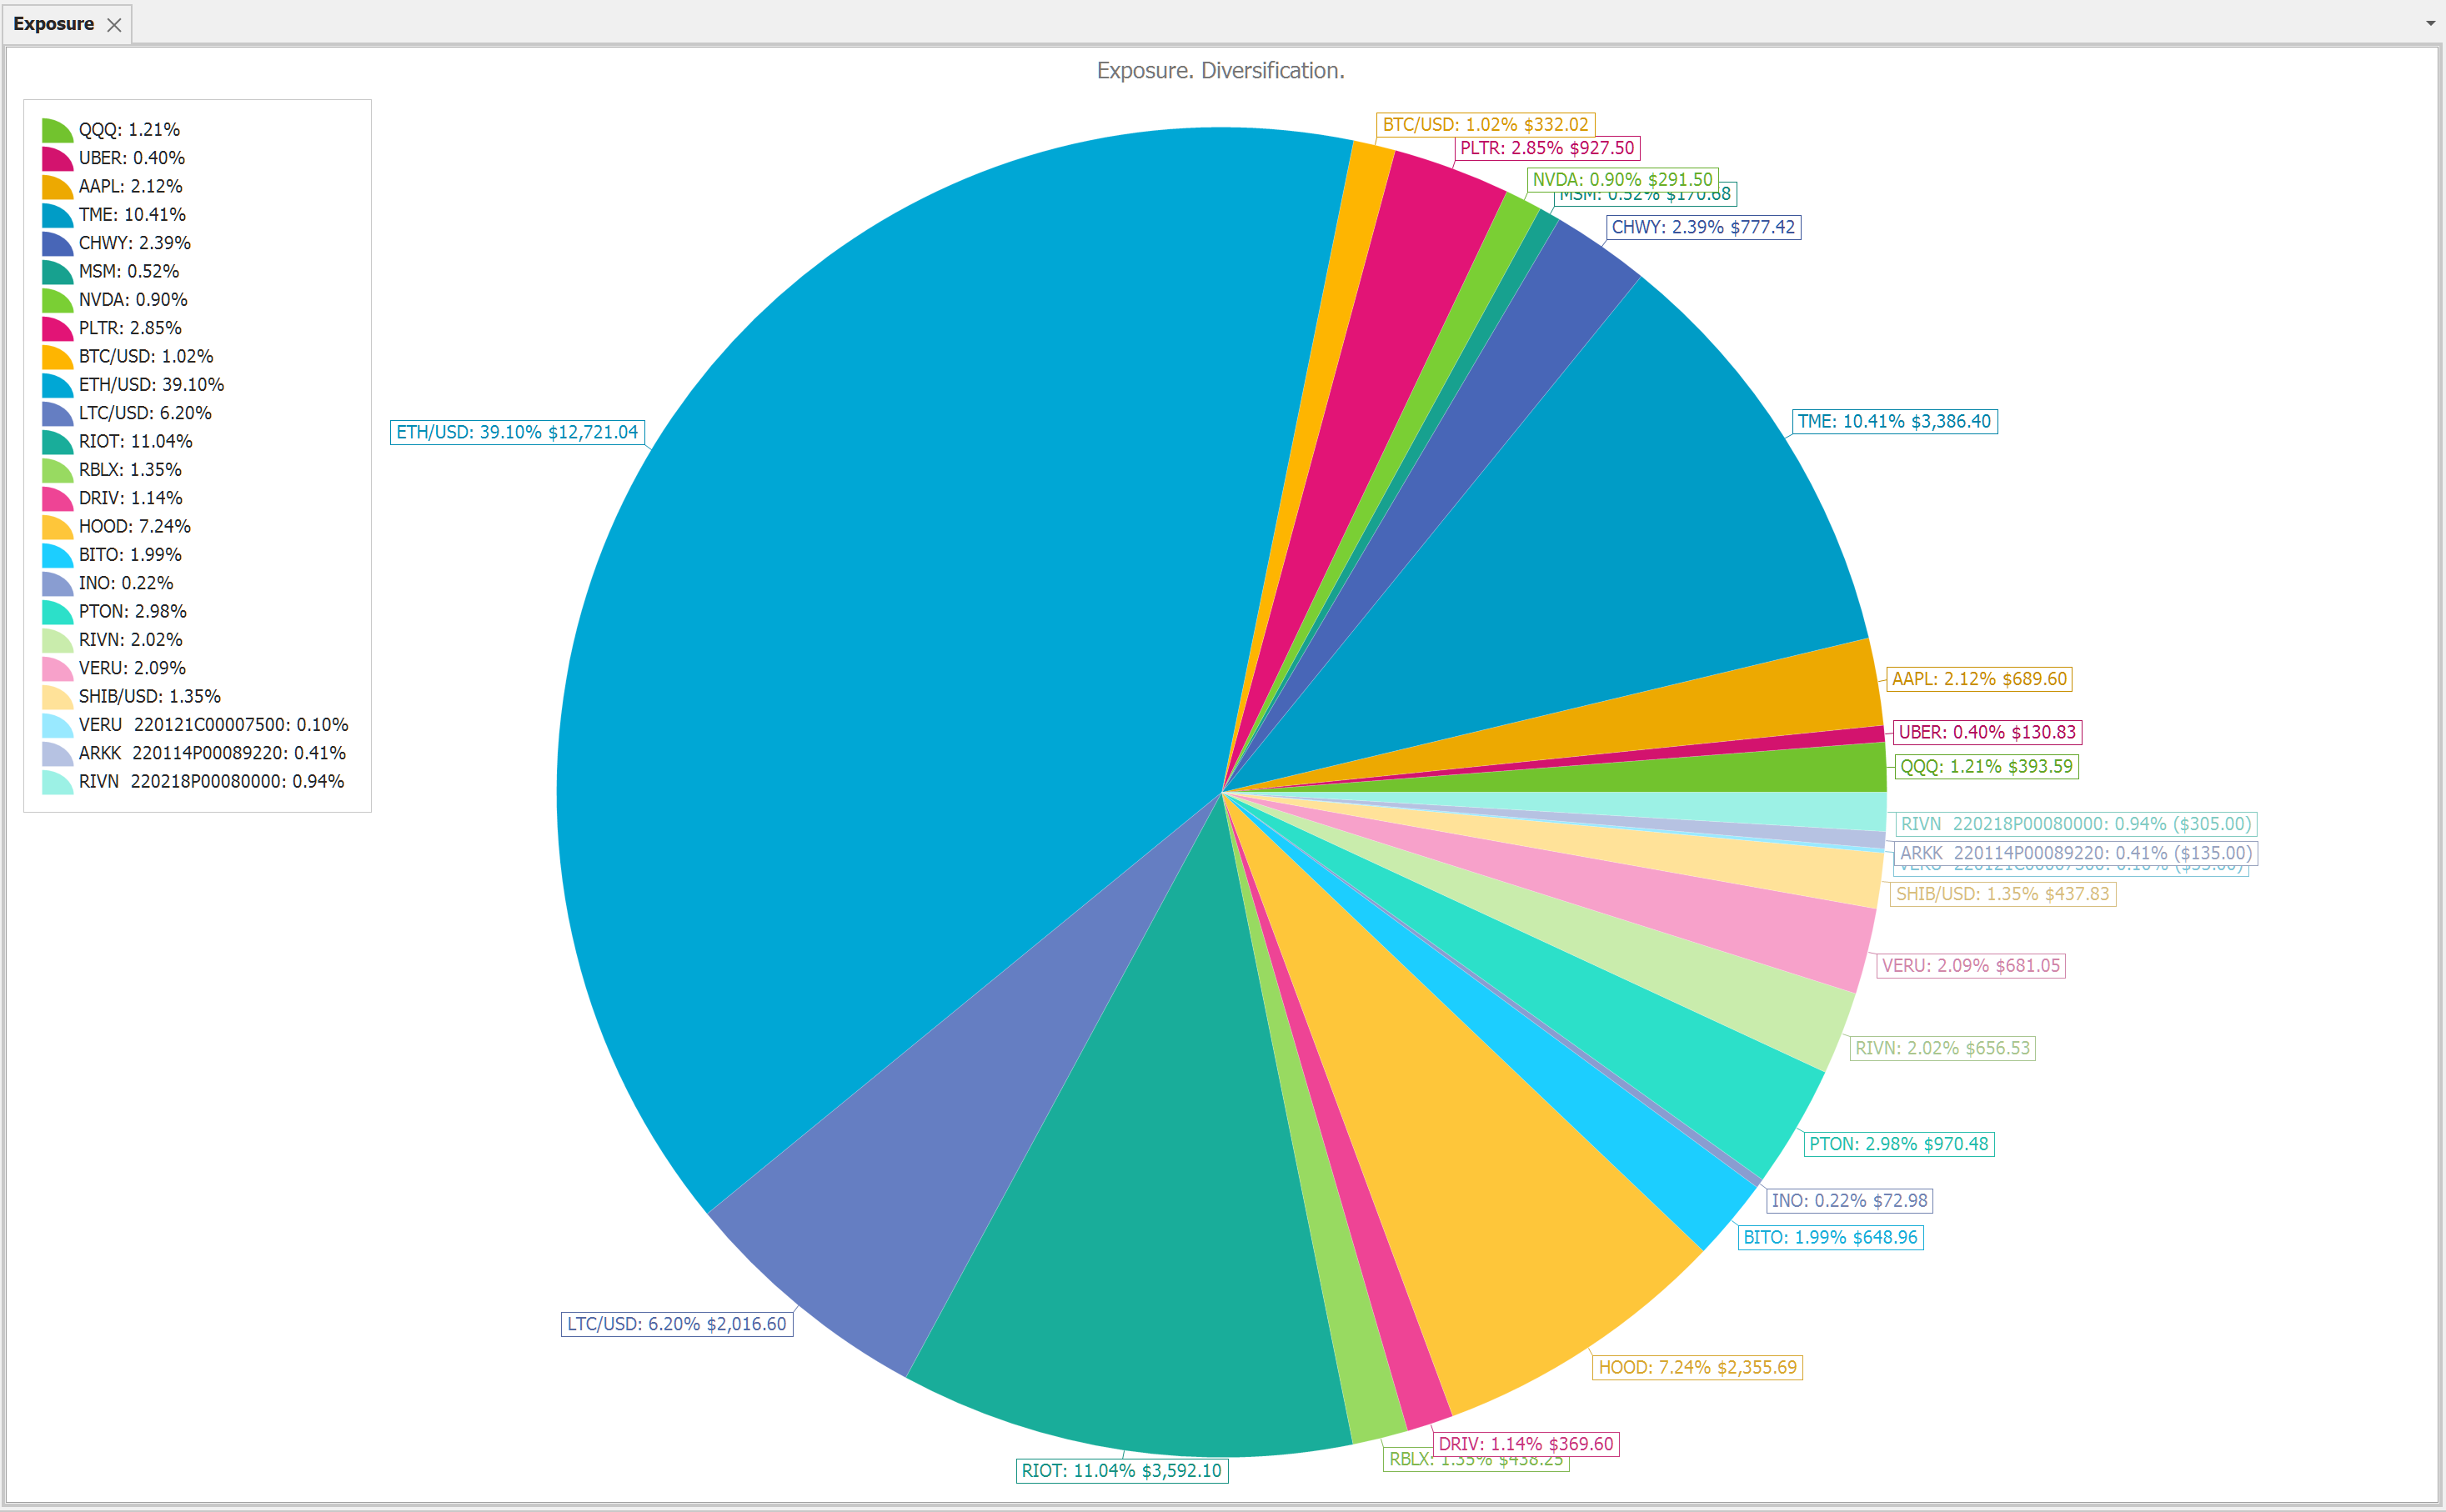
Exposure is a diversification chart and scales the open positions to each other. The chart is a pie chart.
Each pie element size shows an open position amount compared to all open positions.
Context menus (right click on the chart):
• Print Preview
• Export To. You can export the report to different formats like HTML, Excel, Word or PDF
• Save Image As. Saves chart as image. Supported formats are: JPG, BMP, PNG
• Copy to clipboard
Settings
• Combine accounts. By ticking this setting, the exposure of the open positions will be calculated against the sum of the total equities of all accounts.
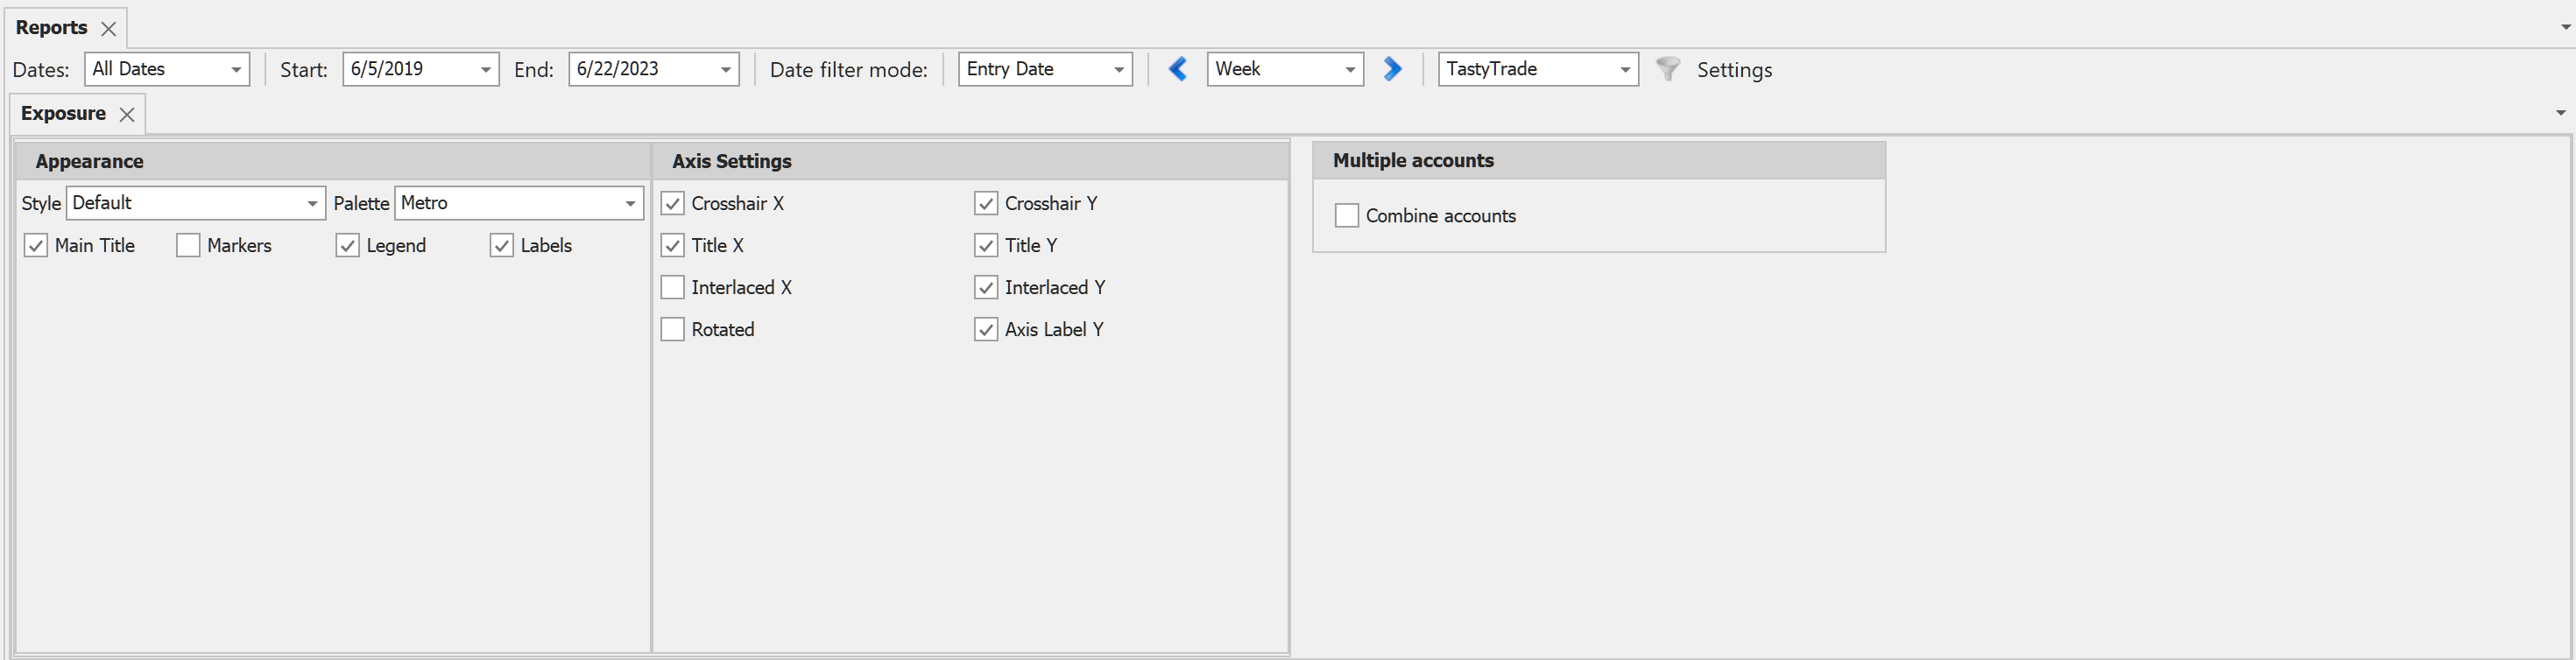
Available filters:
All filters are available.
![]() Note. By setting the filter's end date back you can watch your open positions in the past according to the filter's End Date.
Note. By setting the filter's end date back you can watch your open positions in the past according to the filter's End Date.