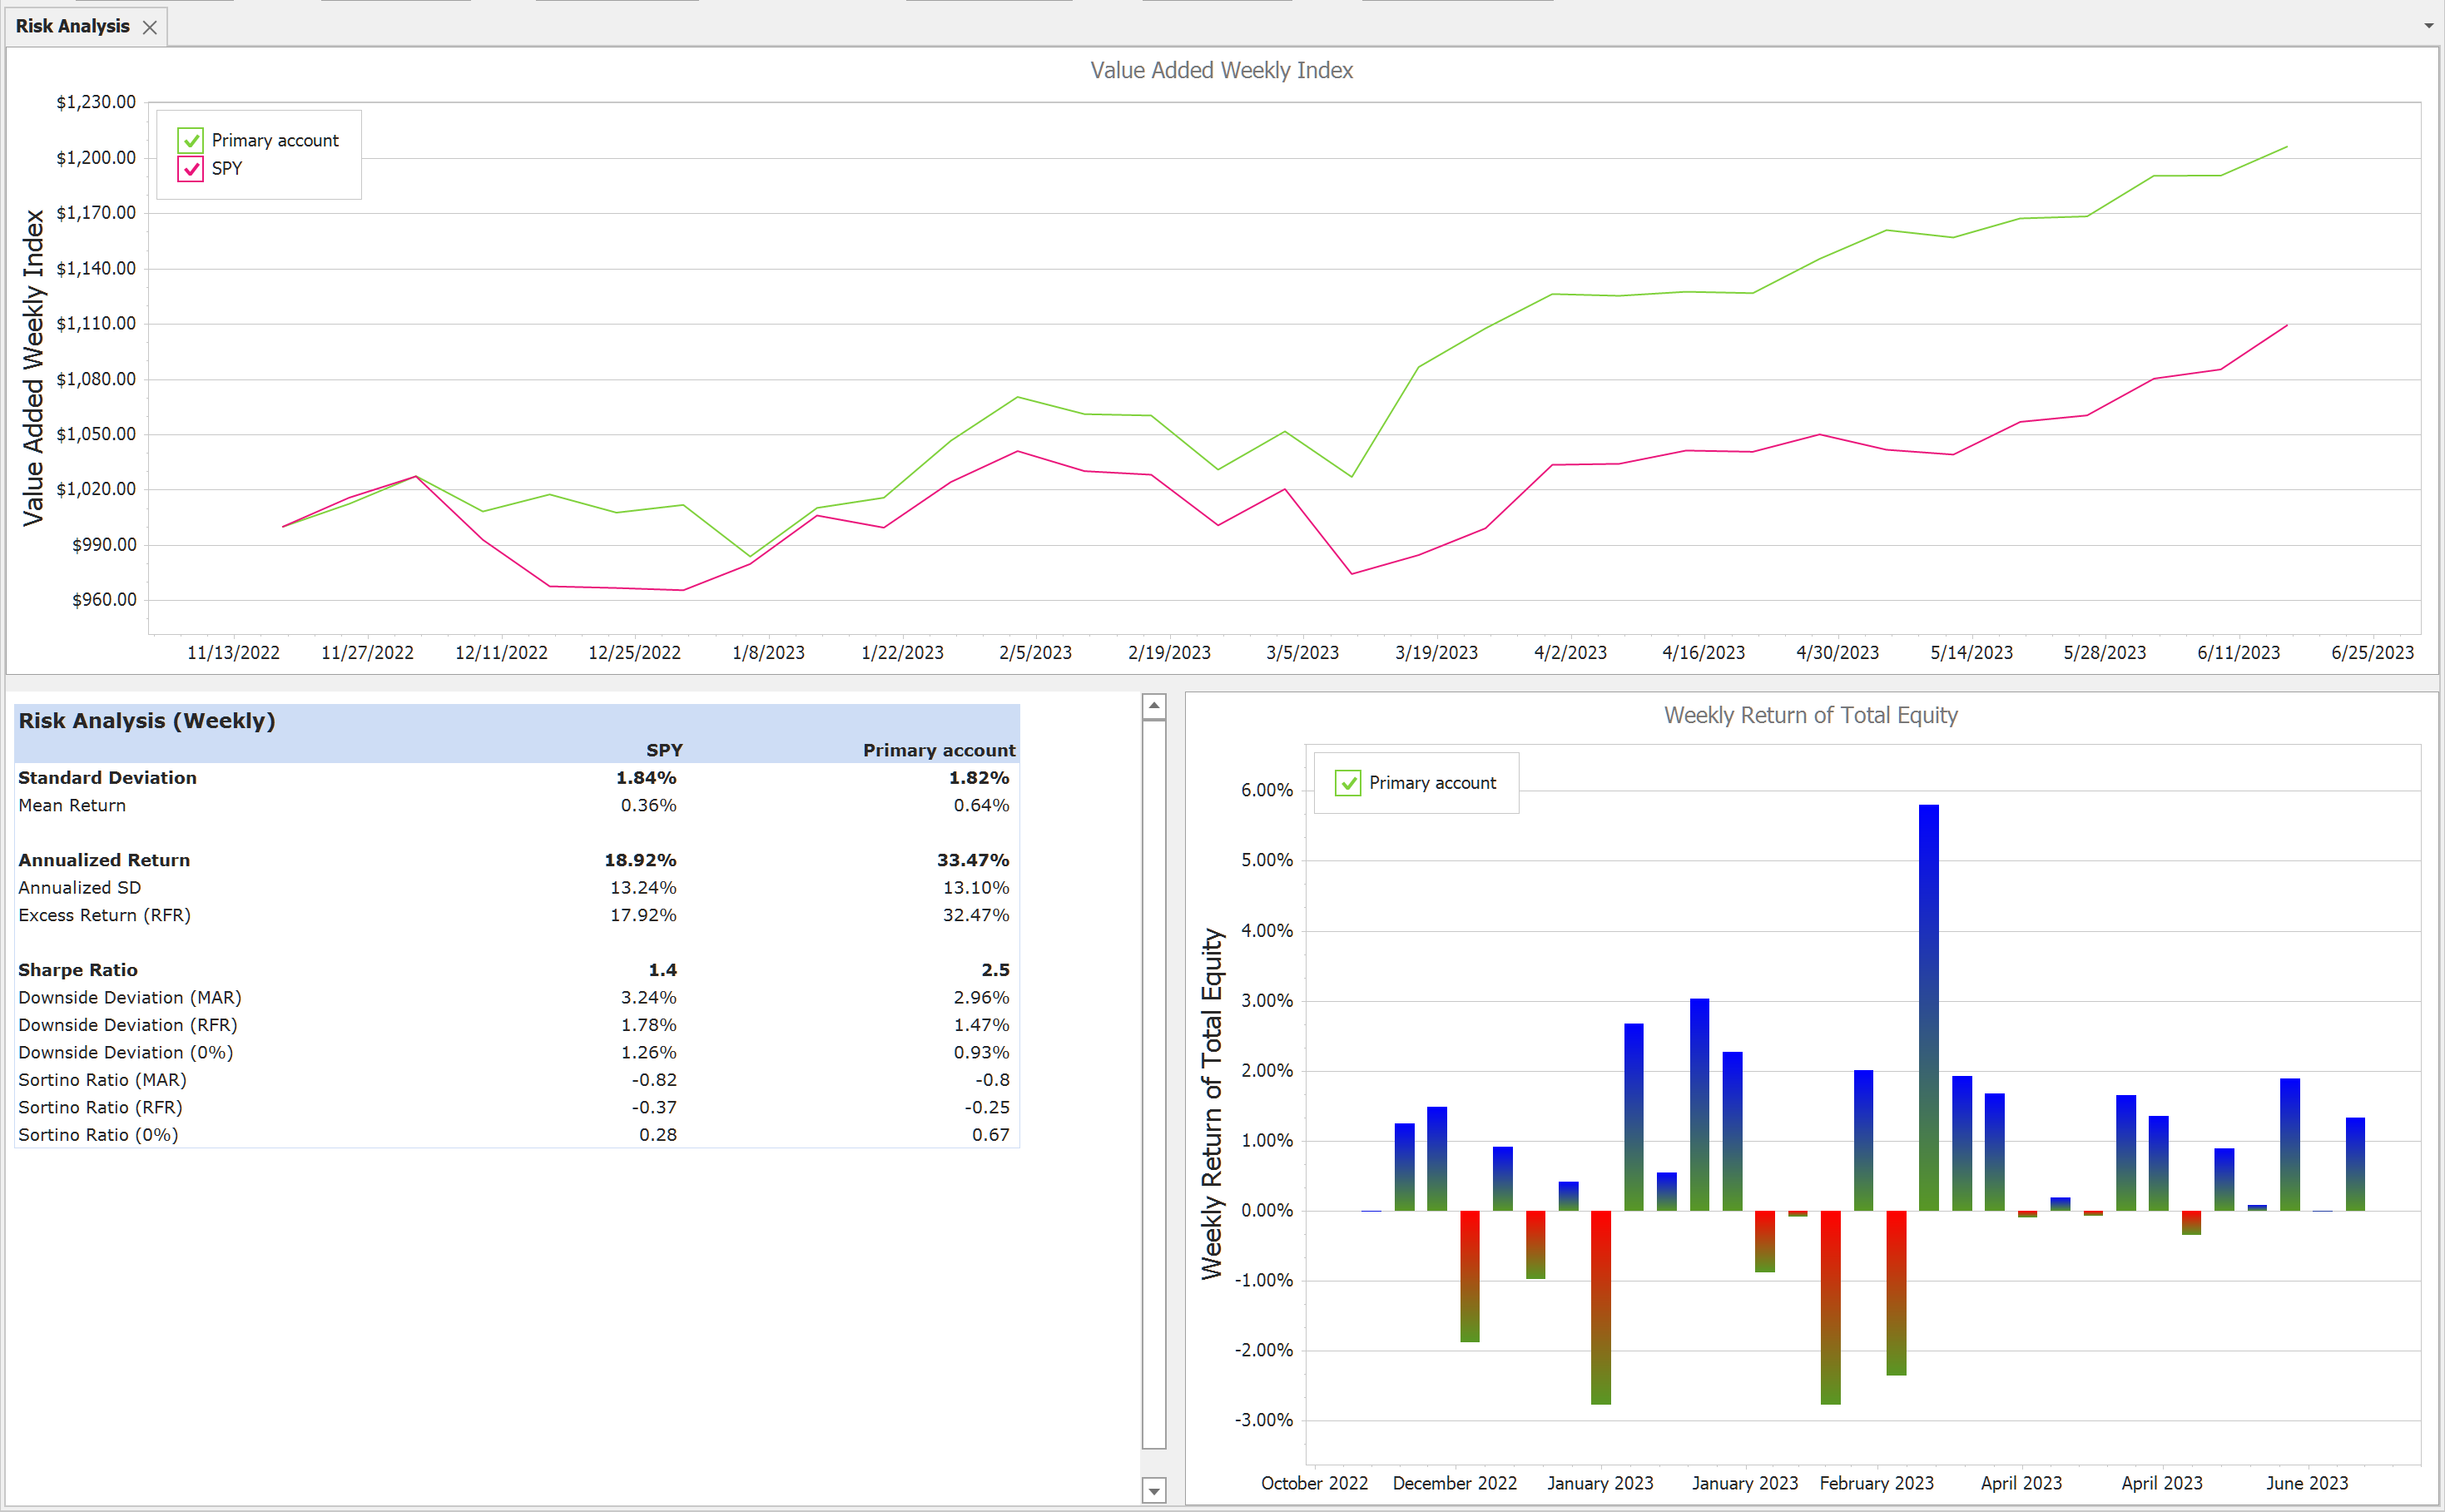
The Risk Analysis report contains three parts. The first (top) part is chart which shows the a VAMI chart for your portfolio compared to the benchmarks.
The second part(bottom left) is the report itself, which contains a lot of risk measurement values. The third part(bottom right) is the monthly return of the total equity.
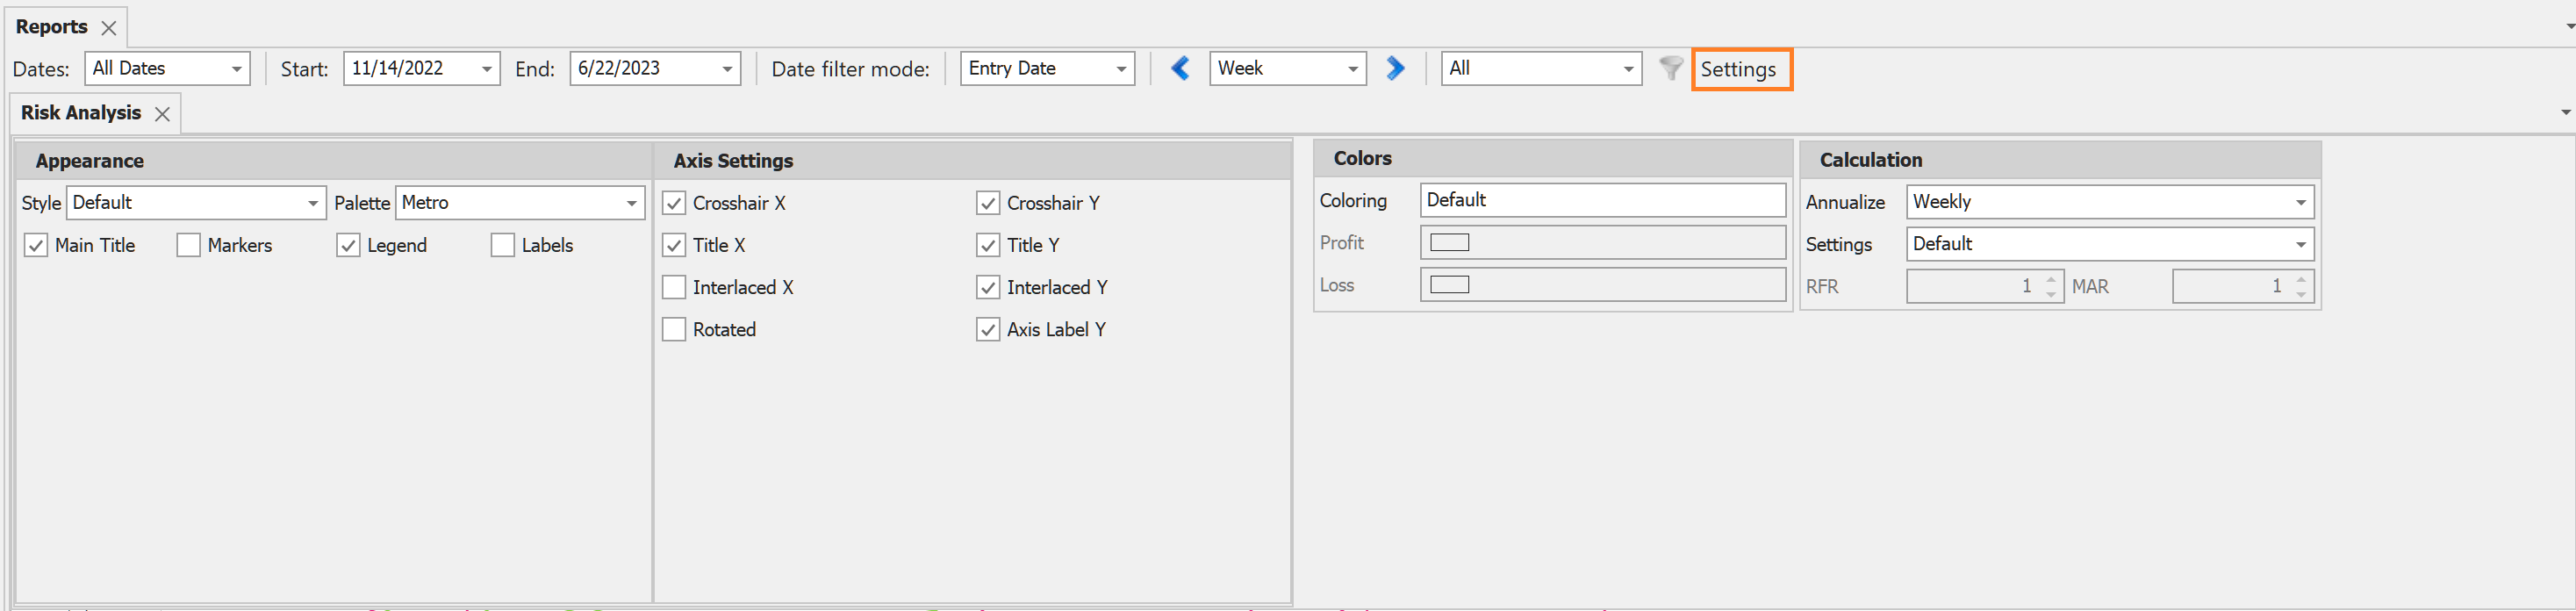
Settings
• Colors. you can change the Profit or Loss color or use the default values defined under the Options Look and Feel settings.
• Calculation
oAnnualize. changes the annulatization method. There are three possible values: Weekly, Monthly and Yearly.
oSettings. Post modern portfolio theory settings. You can use the default values, which are set in the Options or give specific values for the given report.
▪RFR - Risk Free Rate in percentage.
▪MAR - Minimum Acceptable Return.
Financial formulas used in the risk analysis:
Standard Deviation = degree of variation of returns. Calculated as (((R1 – M)2 + (R2 – M)2 + … + (RN – M)2) / (N-1))1/2 where Ri – return of specific month, M – mean of return, N – number of months. |
M = mean of return for the specified period. Calculated as (R1 + R2 + R3 + … RN) / N for all specified periods. Ri – return of i-th period, N is a number of months. |
R = (Gain Factor power 12/N) - 1 where the Gain Factor = ending value / starting value and N is a number of months |
Annualized Standard Deviation = Standard Deviation * SQRT(12) - where 12 is the months in one year |
Excess Return (RFR) = Annualized Return - Risk Free Rate |
Sharpe Ratio = Excess Return (RFR) / Annualized SD. Sharpe Ratio is a risk-adjusted measure of the excess return brought to an investment portfolio and how efficient it is on a risk/reward per unit basis. William F. Sharpe invented the Sharpe Ratio in 1966. The higher the Sharpe Ratio the better. |
Downside deviation = ((L12 + L22 + … + LN2) / N)1/2 . Where Li = min(Ri – MAR, 0), N – number of months in calculation. |
Downside deviation = ((L12 + L22 + … + LN2) / N)1/2 . Where Li = min(Ri – RFR, 0), N – number of months in calculation. |
Downside deviation = ((L12 + L22 + … + LN2) / N)1/2 . Where Li = min(Ri, 0), N – number of months in calculation. |
Sortino Ratio = (Compound monthly return - MAR) / Downside Deviation (MAR). Where MAR = minimum acceptable return |
Sortino Ratio = (Compound monthly return - RFR) / Downside Deviation (RFR). Where RFR = risk free rate |
Sortino Ratio = (Compound monthly return) / Downside Deviation (0%) |