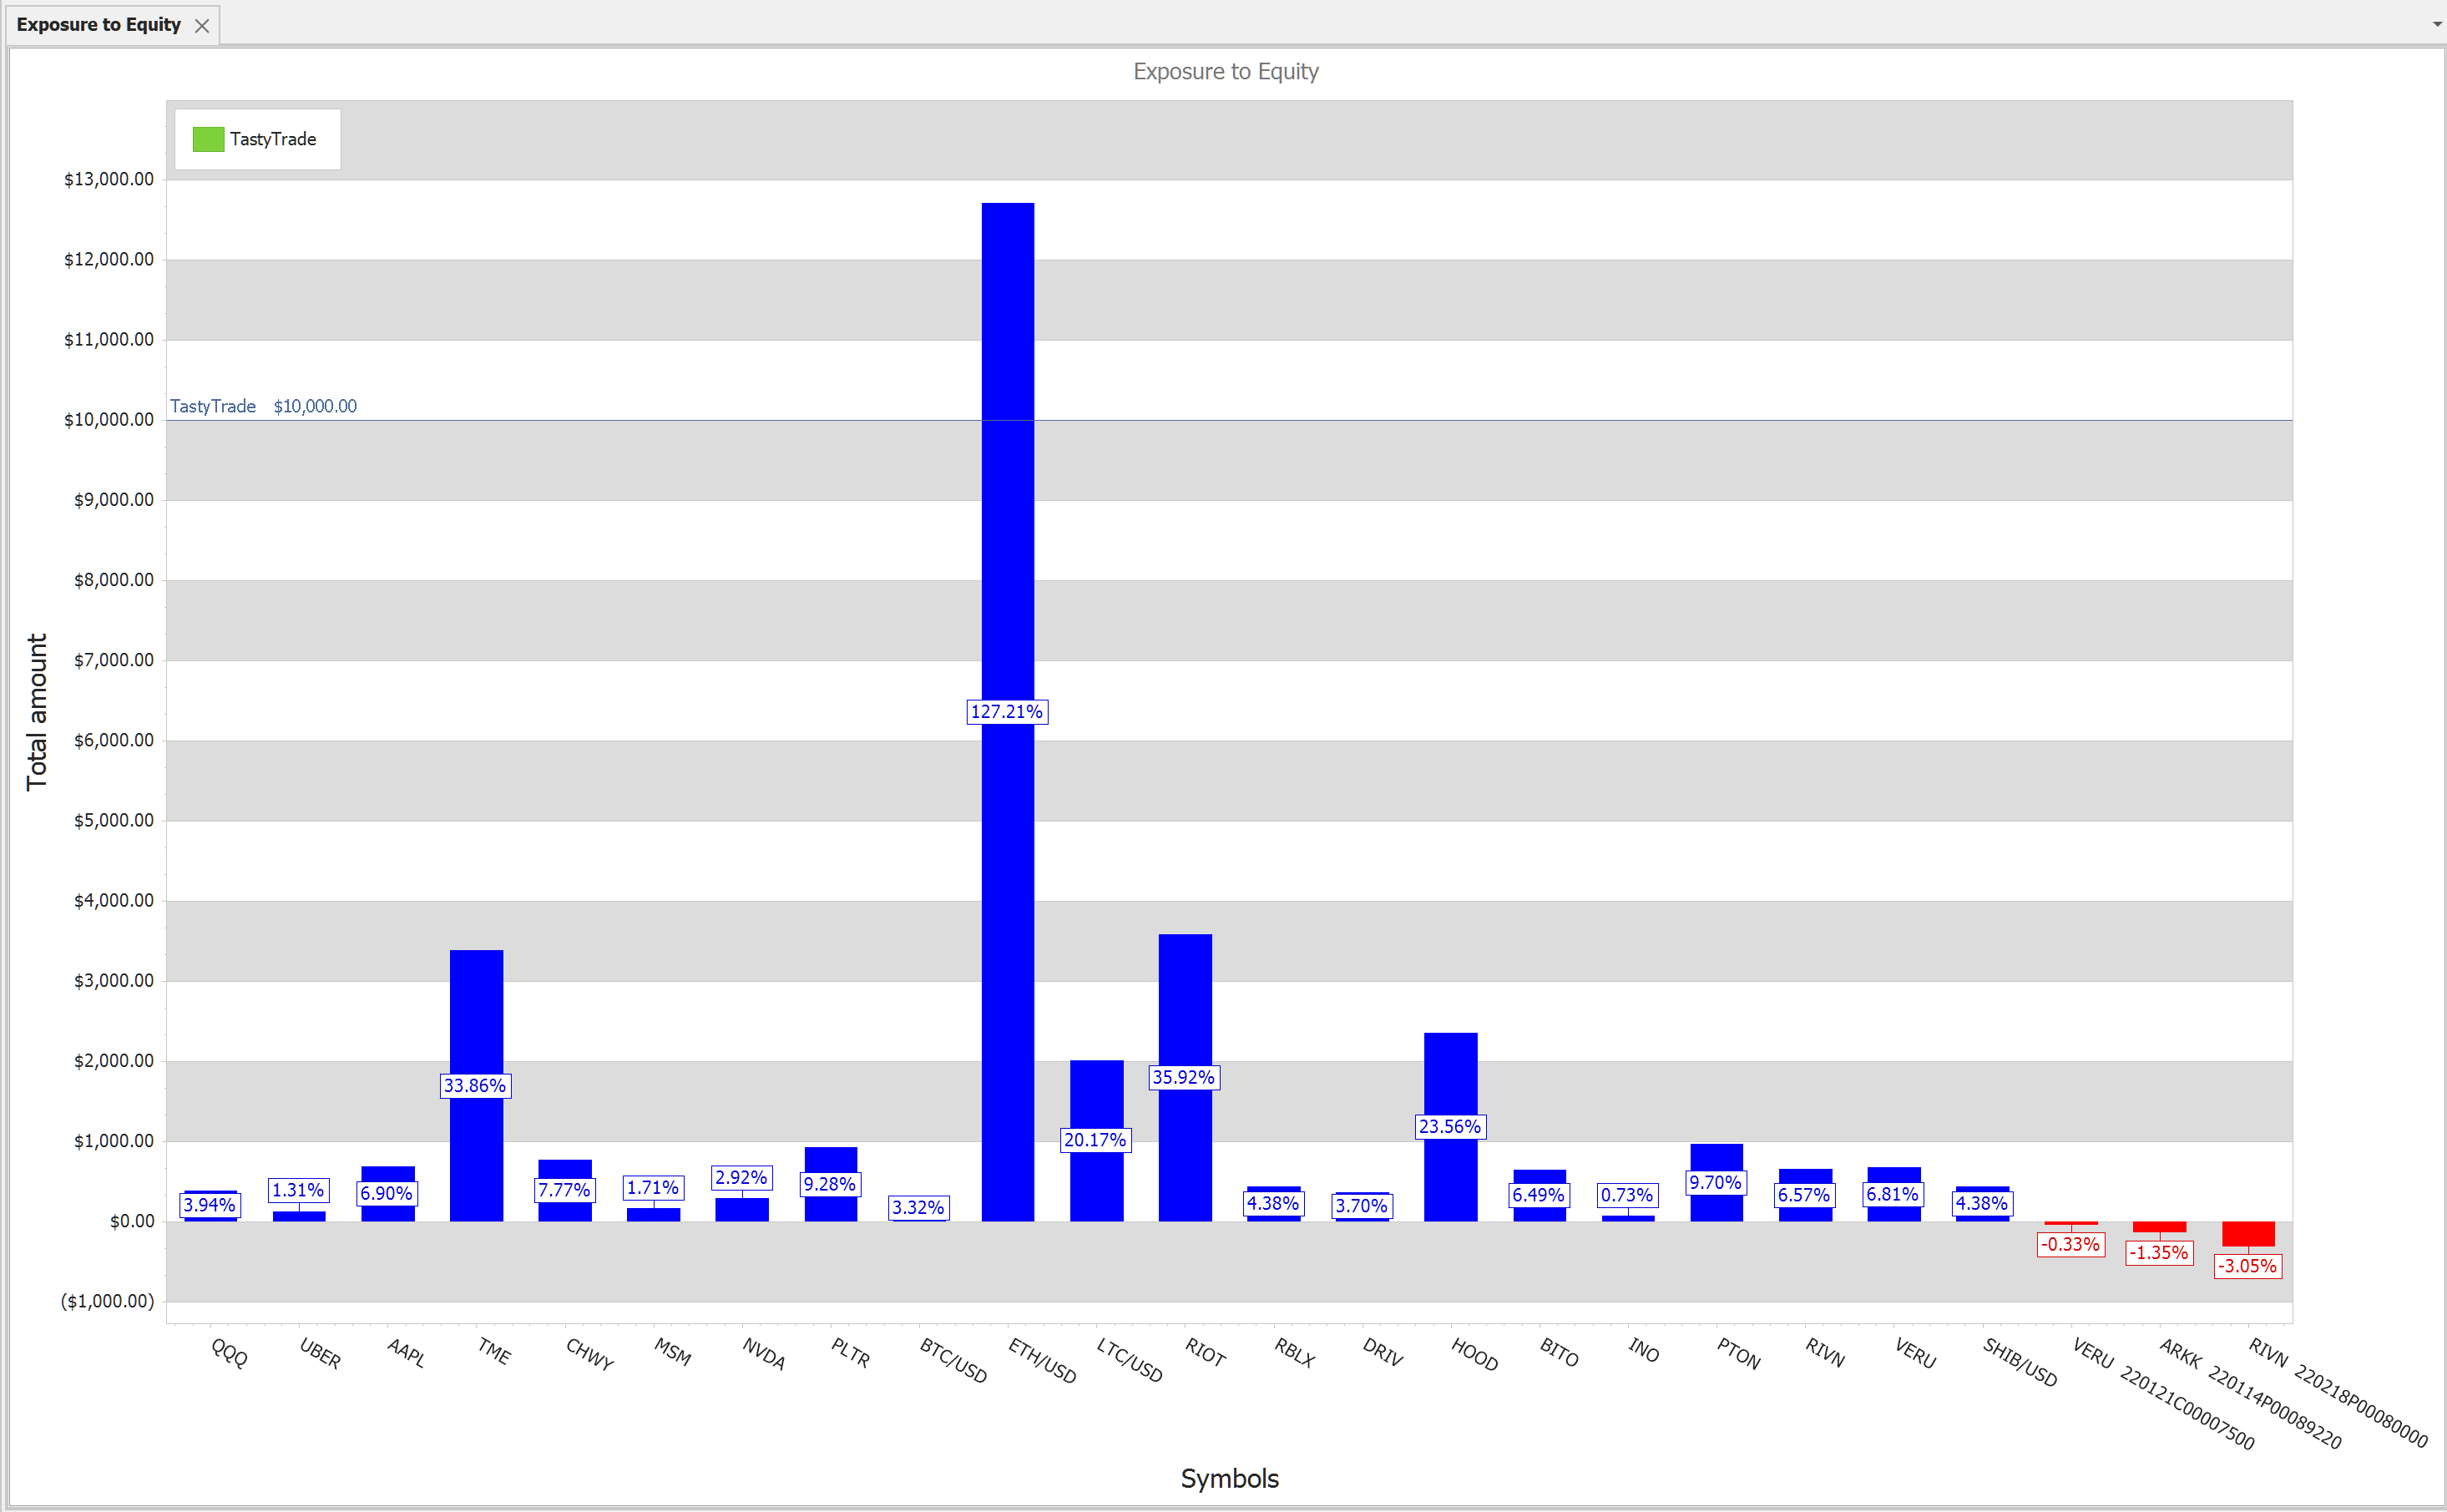
Exposure to Equity is a diversification chart and scales the open positions to the total equity value. The chart is a bar chart with a horizontal line.
Each bar chart shows an open position amount and the percentage inside the bar compared to the current total equity value. There is a horizontal line which shows the actual total equity value.
X Axis: Symbols/tickers of open positions.
Y Axis: Total amount of the position
Context menus (right click on the chart):
• Print Preview
• Export To. You can export the report to different formats like HTML, Excel, Word or PDF
• Save Image As. Saves chart as image. Supported formats are: JPG, BMP, PNG
• Copy to clipboard
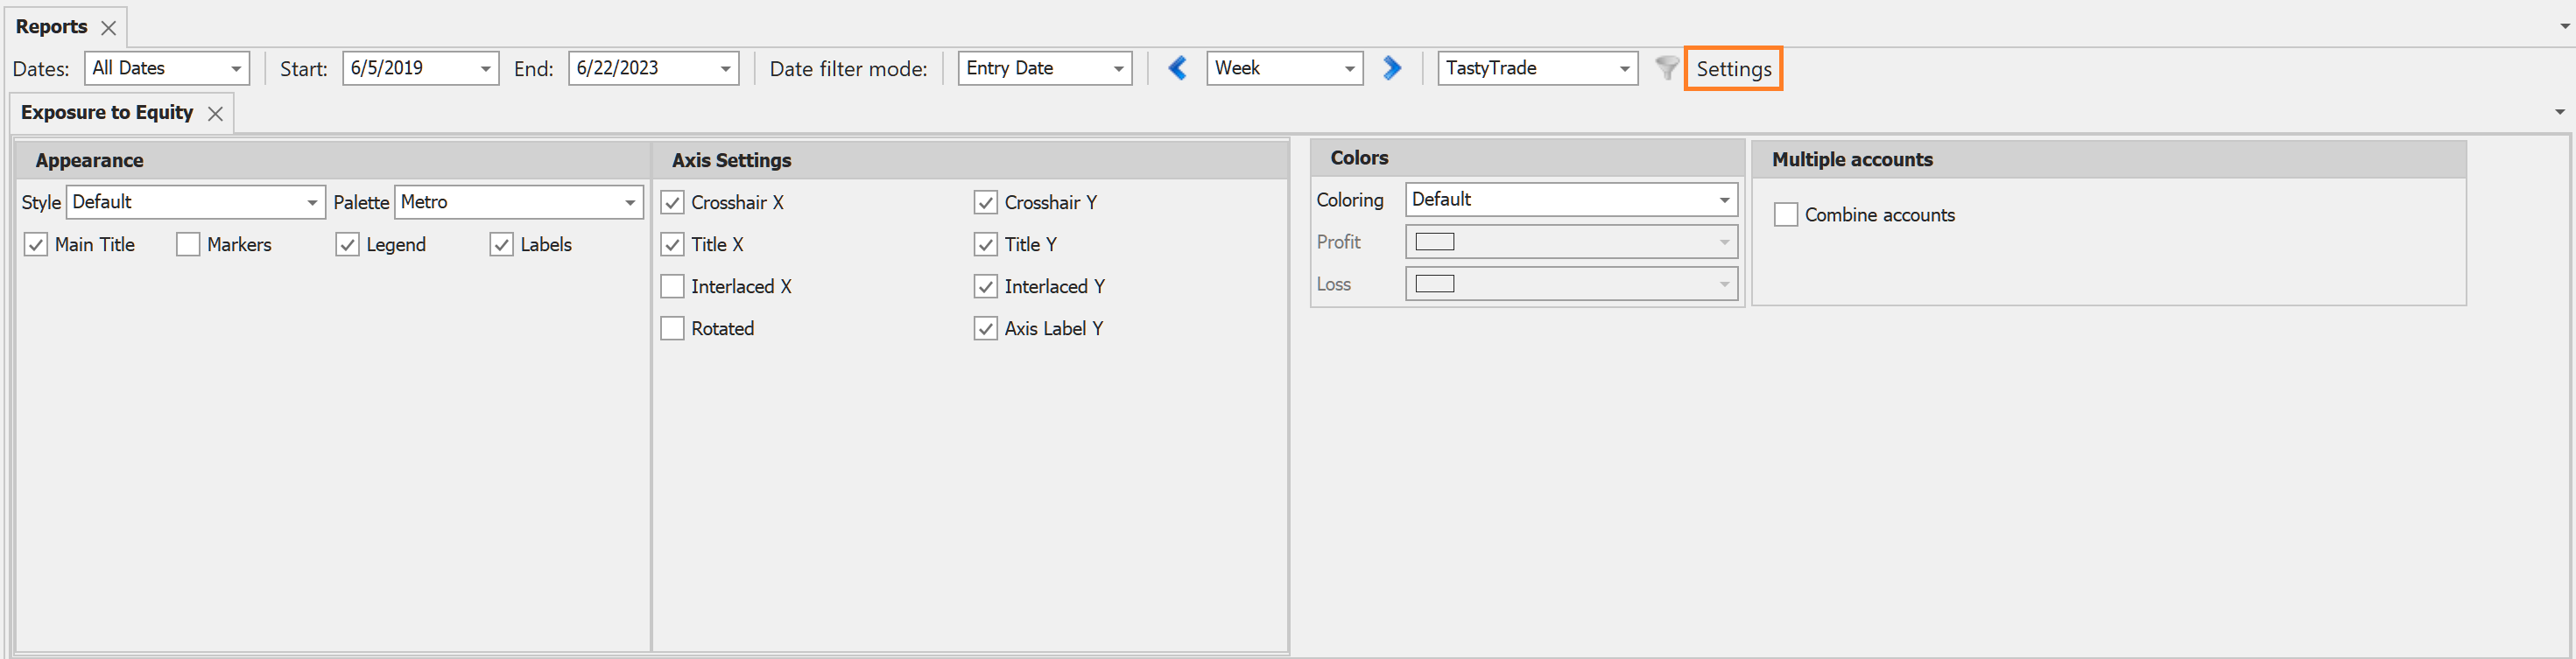
Settings
• Colors. you can change the Profit or Loss color or use the default values defined under the Options Look and Feel settings.
• Combine accounts. By ticking this setting, the exposure of the open positions will be calculated against the sum of the total equities of all accounts.
Available filters:
All filters are available.
![]() Note. By setting the filter's end date back you can watch your open positions in the past according to the filter's End Date.
Note. By setting the filter's end date back you can watch your open positions in the past according to the filter's End Date.