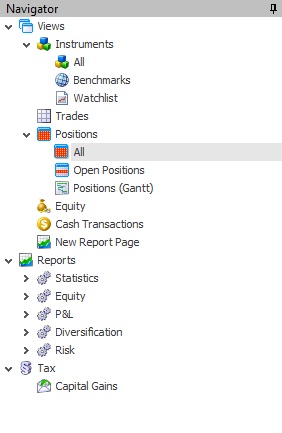
The Navigator window contains a tree view with which you can reach the functions of TradingDiary Pro. To open a leaf double click on it. Double click on any function within the leaf.
Views
With the help of the elements under Views you can open different views.
oInstruments - all instrument related views
▪All - this view contains all instruments
▪Benchmarks - shows benchmarks instruments only
▪Watchlist - shows watchlist instruments only
▪
oReports
▪Statistics
•Performance - shows the performance window
•Time of open positions - shows the time length of open positions
▪Equity
•Equity history - shows the Total Equity curve
•Equity gain or loss - shows the equity gain or loss report
•Leverage - shows the leverage report
•Drawdown - shows the drawdown report
▪Profit and loss
•Cumulative - shows the profit/loss cumulative report
•Distribution - shows the profit/loss distribution report
•Time distribution - shows the P&L time distribution report
•Filter distribution - shows the Filter distribution report
▪Diversification
•Positions to total equity - shows the positions to total equity chart
•Positions to each other - shows the positions to each other chart
▪Risk
•Analysis - shows the risk analysis report
•R Multiple distribution - shows the R Multiple distribution report
•R Multiple cumulative - shows the $ Multiple cumulative report
oTax
▪Capital gains - shows the capital gains tax report