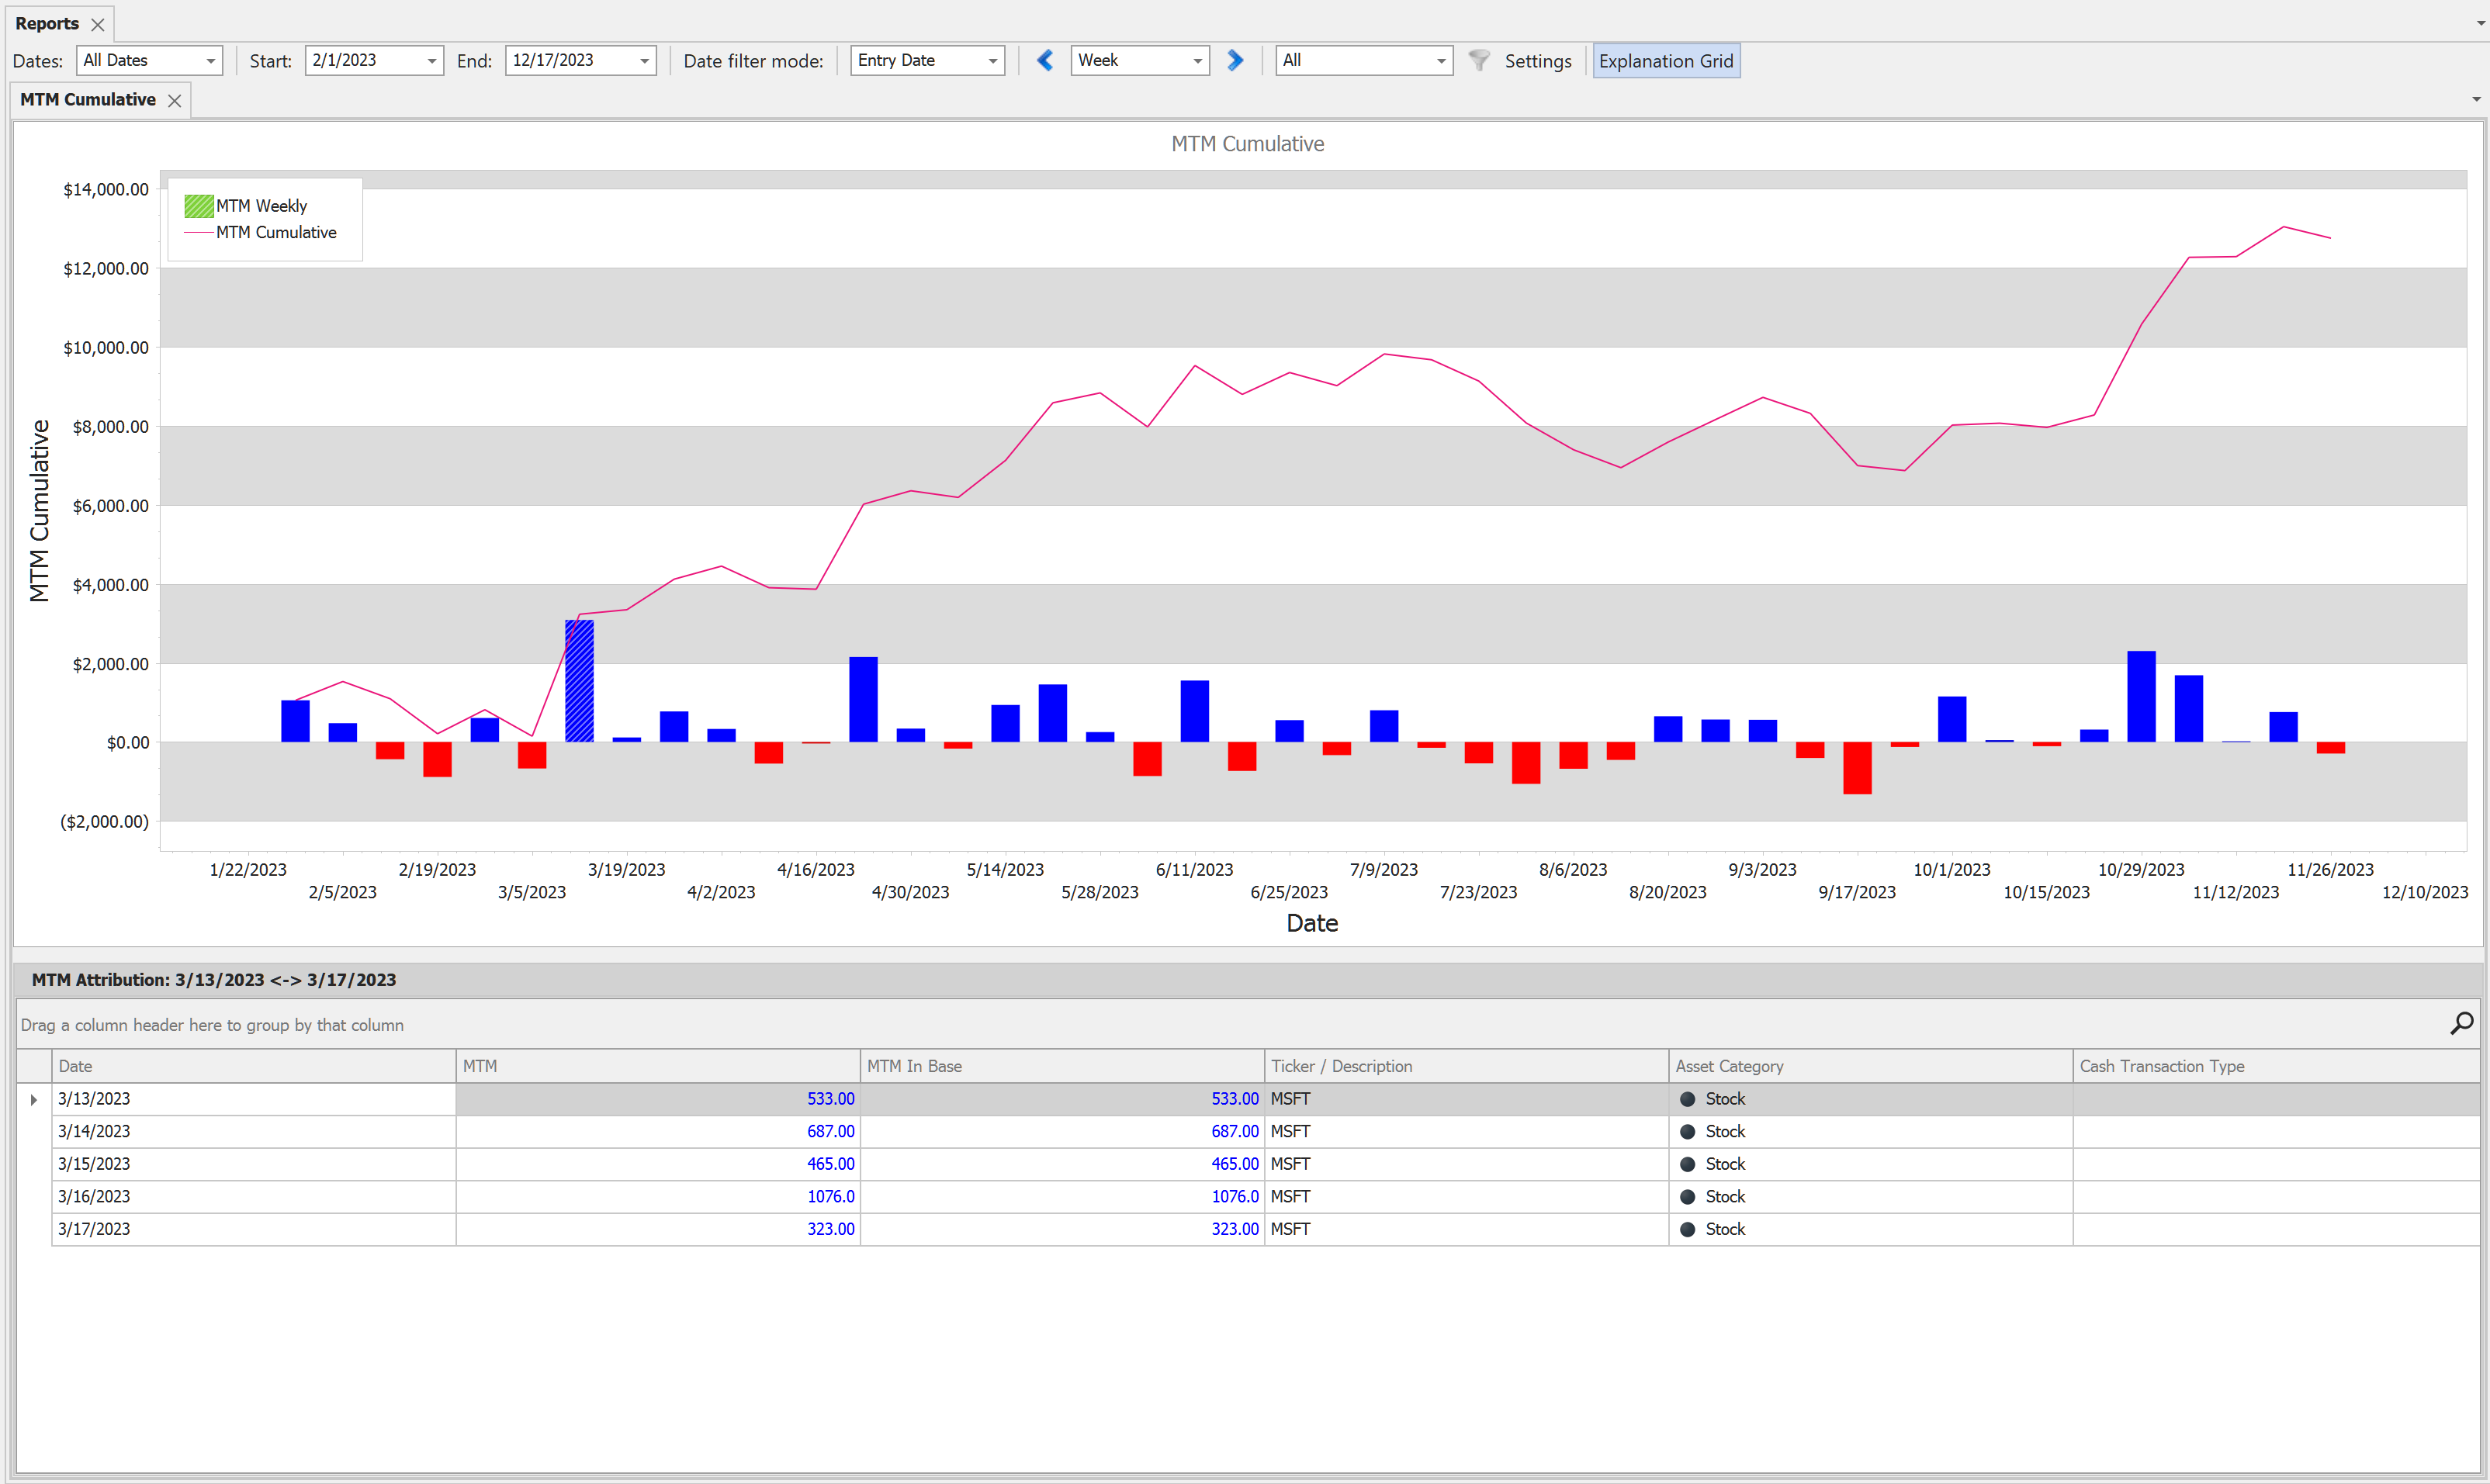
MTM Cumulative chart is based on the market to market values. The chart has two elements:
• a line chart which shows the Market to Market cumulative value
• a bar chart which shows the Market to Market values for a date period set by the resolution value.
Please note. Market to Market values based on the historical data. If there is no historical data for a particular instrument there will not MTM data for that positions of that instrument.
Context menus (right click on the chart):
• Print Preview
• Export To. You can export the report to different formats like HTML, Excel, Word or PDF
• Save Image As. Saves chart as image. Supported formats are: JPG, BMP, PNG
• Copy to clipboard
Settings
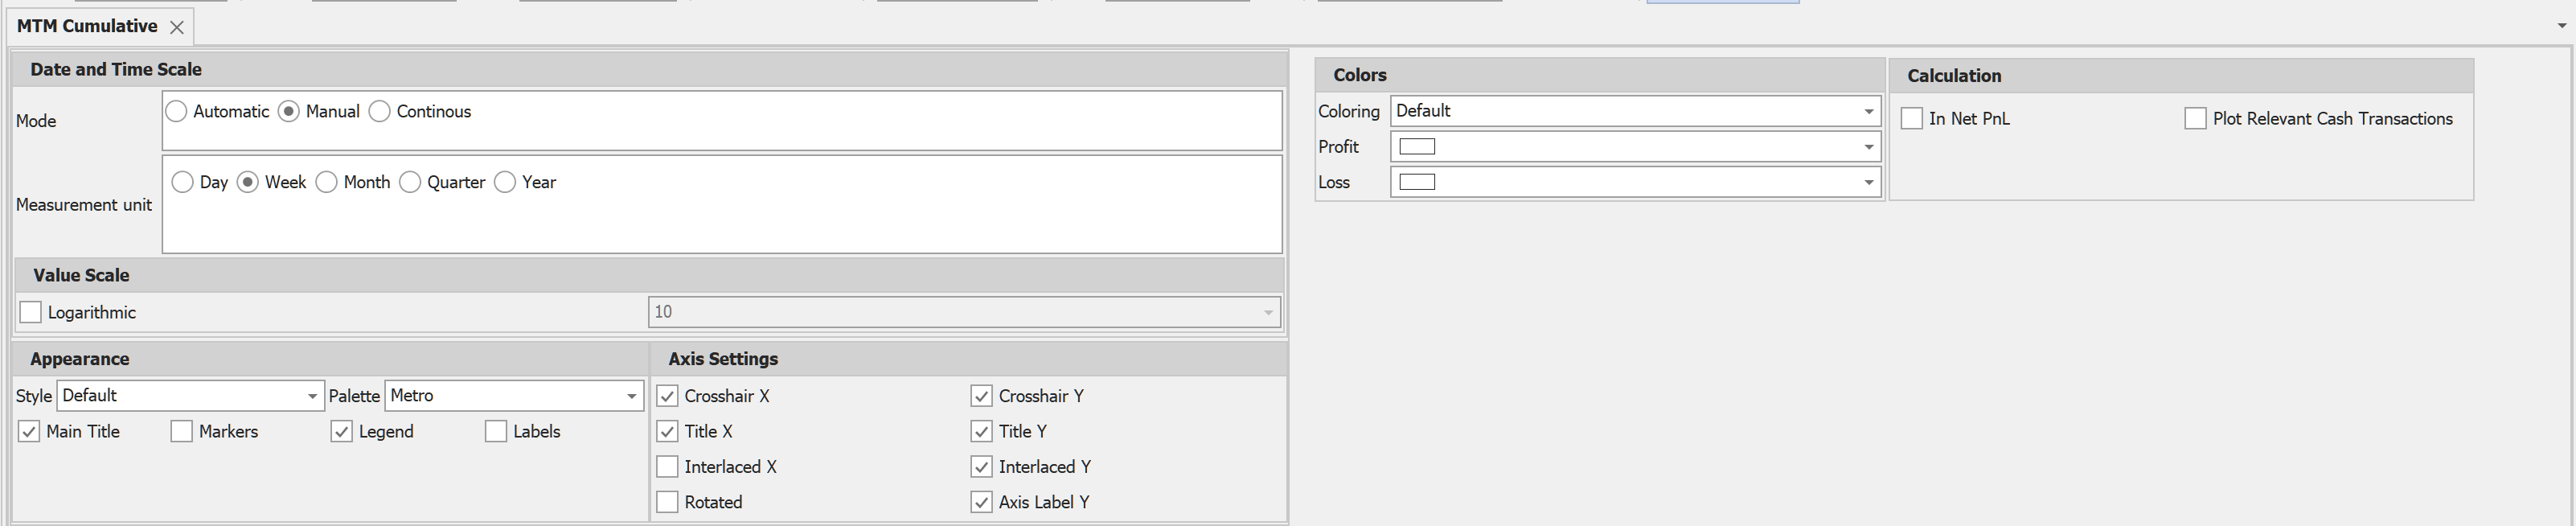
Calculation
•In Net PnL. The MTM will show net PnL. This affected only the first and last day of a position.
•Plot relevant cash transaction. If this checkbox is ticked the cash transactions will be plotted on the chart as well.
Explanation Grid
Click on a chart bar and the the explanation grid shows the attribution of the selected bar.