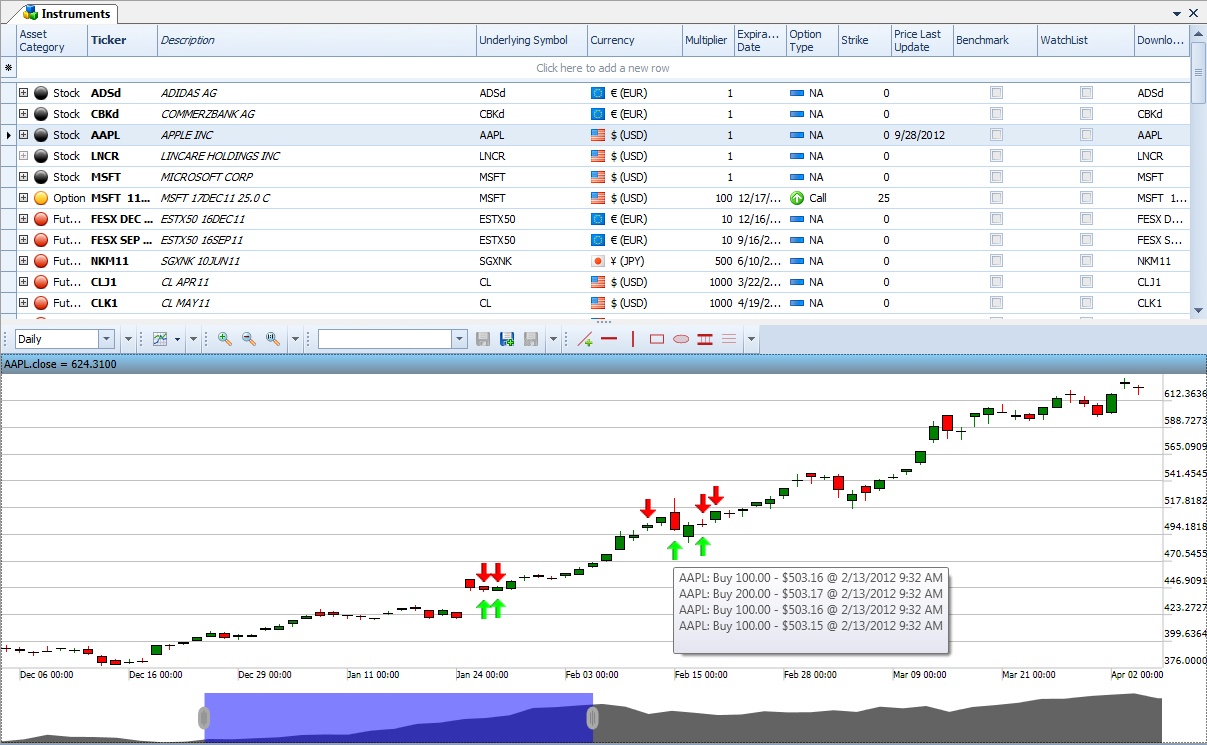
The instruments view contains two separated parts. The first is a hierarchical grid view which contains all instruments. The second part is a chart view which shows the chart of the selected instrument.
Instrument grid
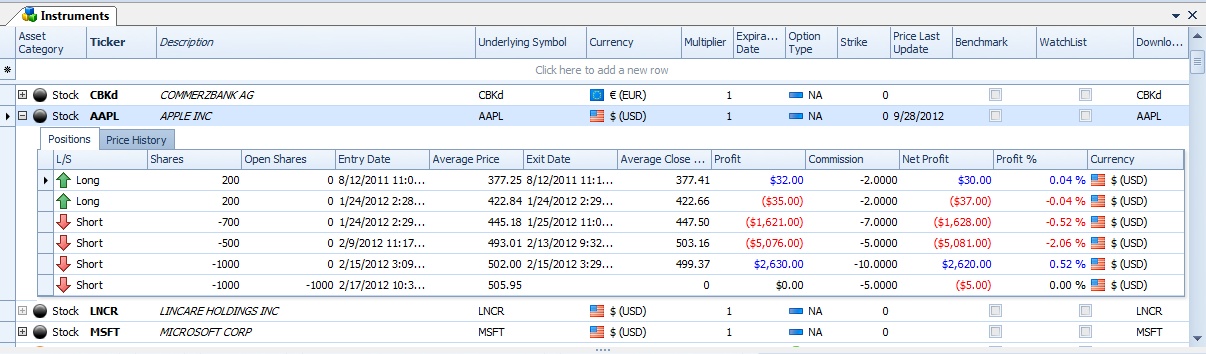
The instrument grid is a hierarchical grid. The master grid shows the instruments. There are two sub grids. The first shows the positions of the instrument and the second one shows the price history values of the instrument. To open the sub grids please click on the small plus sign at left.
Master grid columns:
Column name |
Default visibility |
Note / Description |
Asset Category |
Visible |
|
Ticker |
Visible |
|
Description |
Visible |
|
Underlying Symbol |
Visible |
|
Currency |
Visible |
|
Multiplier |
Visible |
|
Expiration Date |
Visible |
|
Option Type |
Visible |
|
Strike |
Visible |
|
Price Last Update |
Visible |
|
Benchmark |
Visible |
Check this box true if you would like add the instrument to the benchmark list |
Watch list |
Visible |
Check this box true if you would like add the instrument to the watch list |
Primary Exchange |
Hidden |
|
Download Symbol |
Hidden |
If the download symbol of the historical data provider differs use this field to add different symbol for historical download. |
Tick Size |
Hidden |
The tick size value is used to calculate the pips or point for the positions of the instrument. |
Position grid columns:
Column name |
Default visibility |
Note / Description |
Long or Short |
Visible |
Position direction |
Entry Date |
Visible |
|
Exit Date |
Visible |
|
Average Price |
Visible |
Weighted average open price |
Average Close Price |
Visible |
Weighted average close price |
Profit |
Visible |
|
Commission |
Visible |
|
Net Profit |
Visible |
|
Strike |
Visible |
|
Price Last Update |
Visible |
|
Last Trade Date |
Visible |
|
Profit Percentage |
Visible |
Price history columns:
Column name |
Default visibility |
Note / Description |
Date |
Visible |
|
Open |
Visible |
|
Close |
Visible |
|
High |
Visible |
|
Low |
Visible |
|
Volume |
Visible |
Add new instrument:
To add a new instrument please click on Ticker column of the empty row at the bottom of the grid. Fill the appropriate values and press enter or leave the focus from the row.
Context Menu (right click on the grid):
Add new trade - opens the add new trade window for the selected instrument
Delete instrument - deletes the selected instrument(s). Please be careful it this function deletes all instrument related data. Trades, Positions, Orders and the attached documents.
Update price history - Updates price history of the selected instrument
Delete price history - Deletes price history of the selected instrument
Print - prints the contents of the grid
Print preview - shows the print preview window
Apply template - sets a previously saved template for the grid
Delete template - deletes a saved template
Save as new template - saves a template
Export to - exports the grid content to several file formats (html, excel, pdf, rtf, text)
Chart view
The chart view shows the daily chart of the selected instrument.