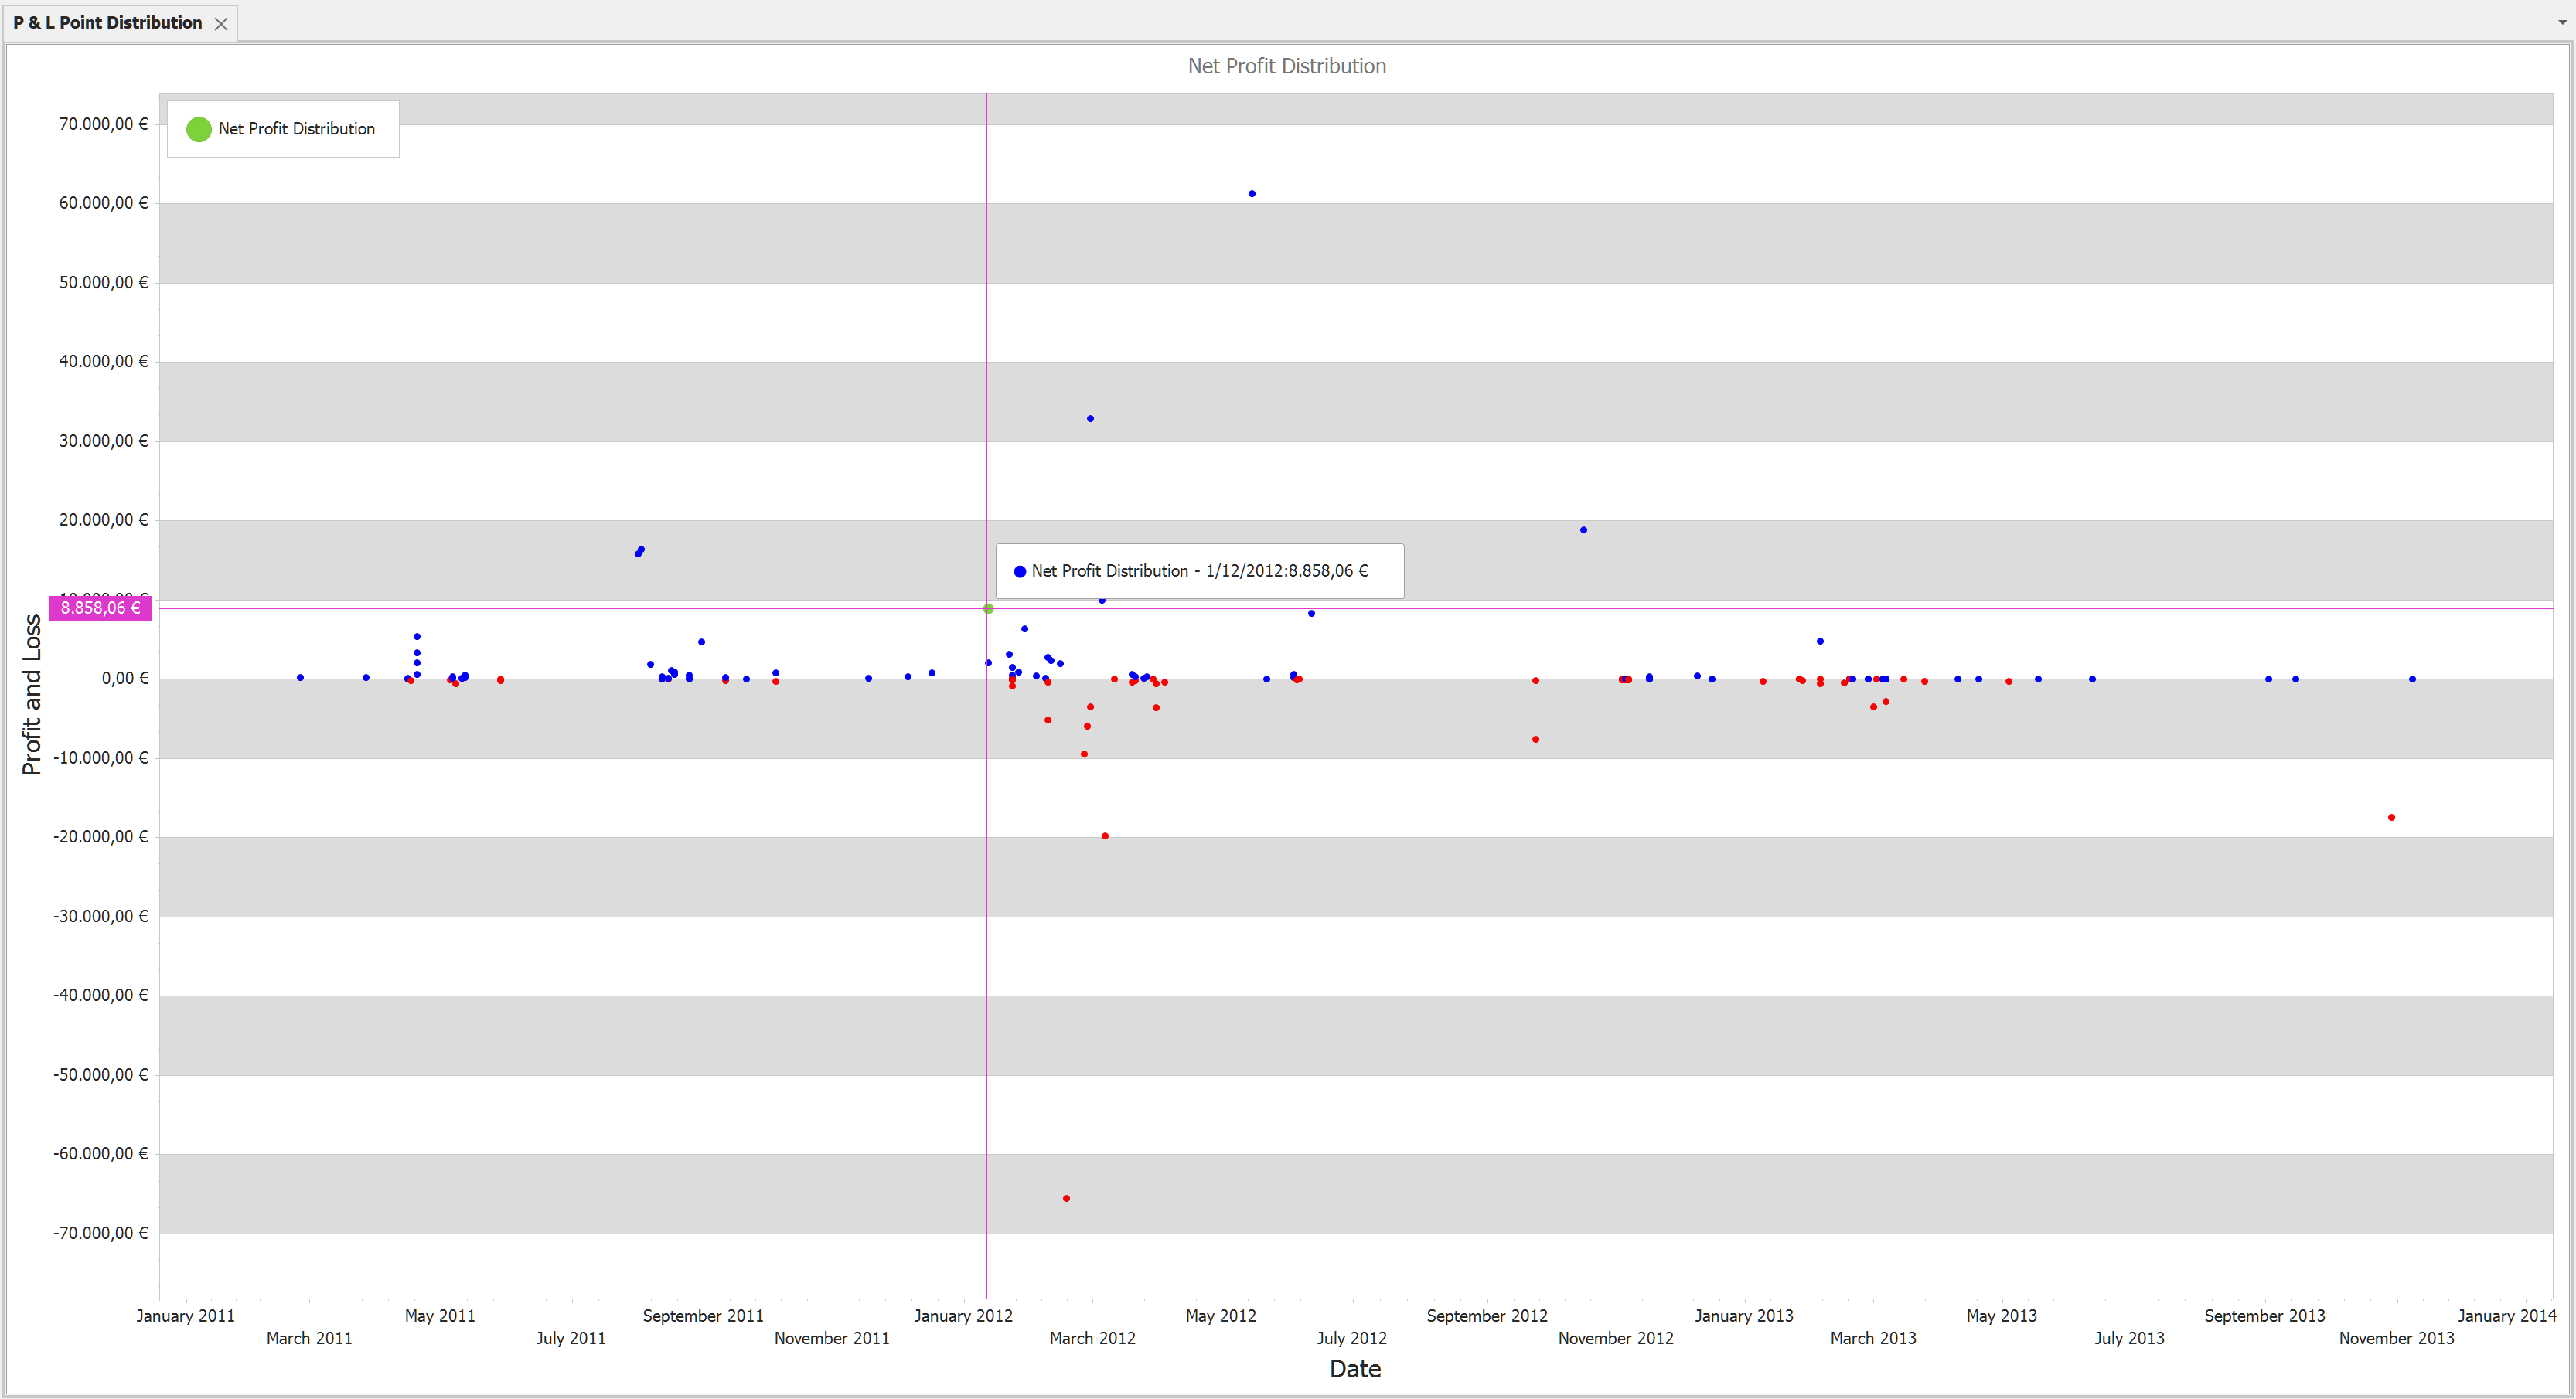
Point Distribution is a point chart which shows the P&L as points over the time.
X Axis: Date
Y Axis: Profit and Loss
Context menus (right click on the chart):
• Print Preview
• Export To. You can export the report to different formats like HTML, Excel, Word or PDF
• Save Image As. Saves chart as image. Supported formats are: JPG, BMP, PNG
• Copy to clipboard
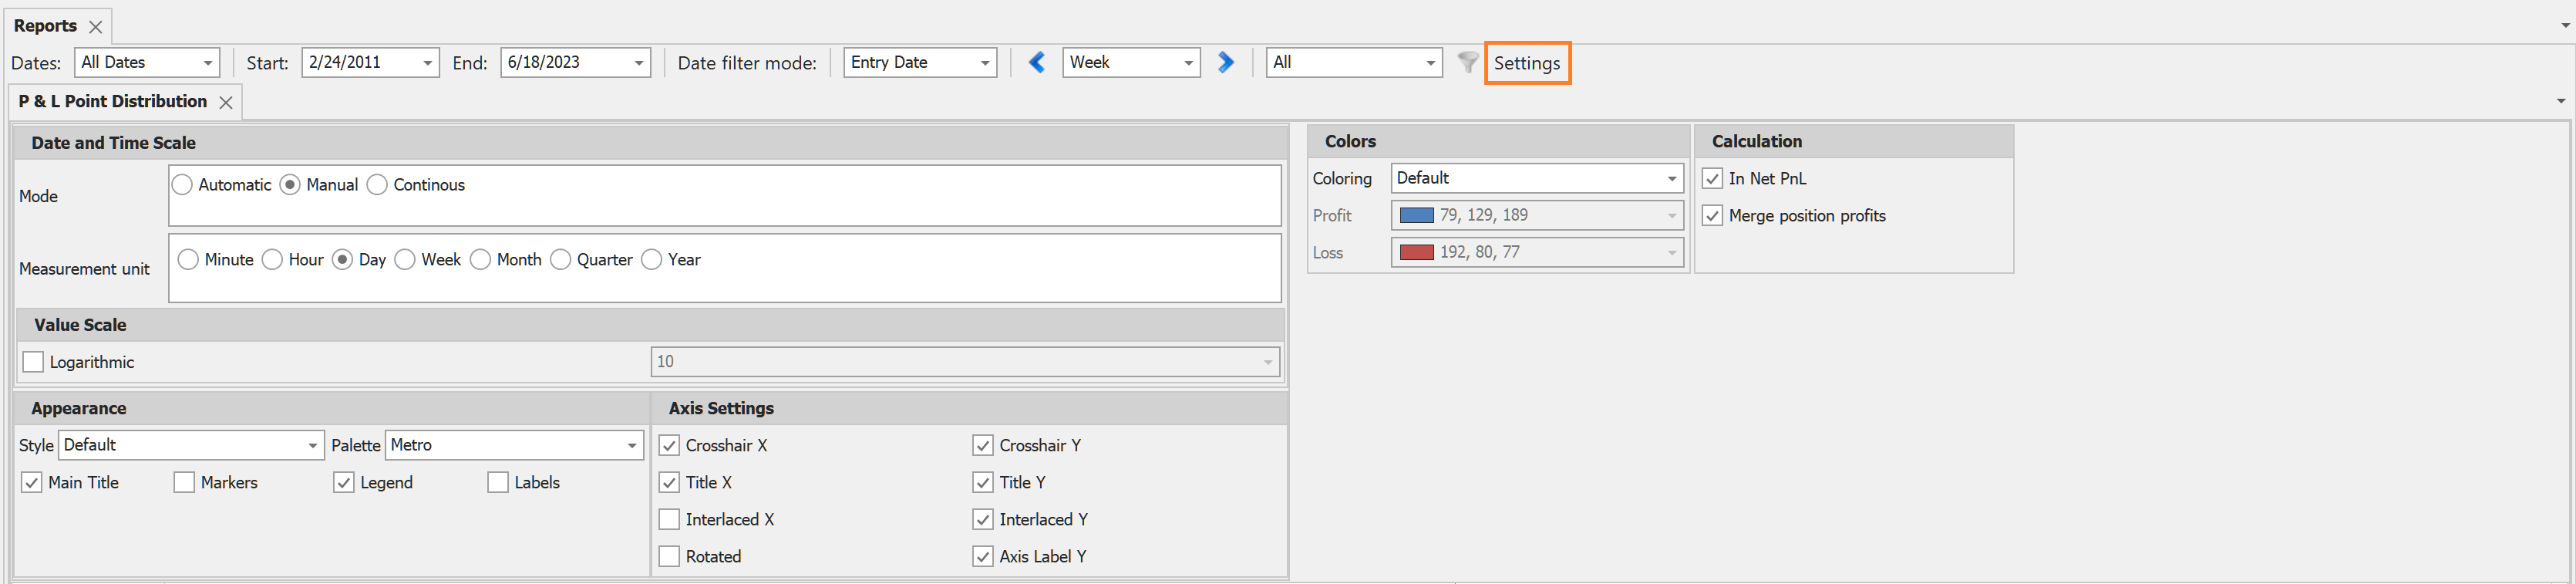
Settings
•Colors. you can change the Profit or Loss color or use the default values defined under the Options Look and Feel settings.
• Calculation
oIn Net PnL. Displays the Net PnL values instead of the PnL.
oMerge position profits. Each position will be plotted as one point in the chart.
Available filters:
All filters are available.