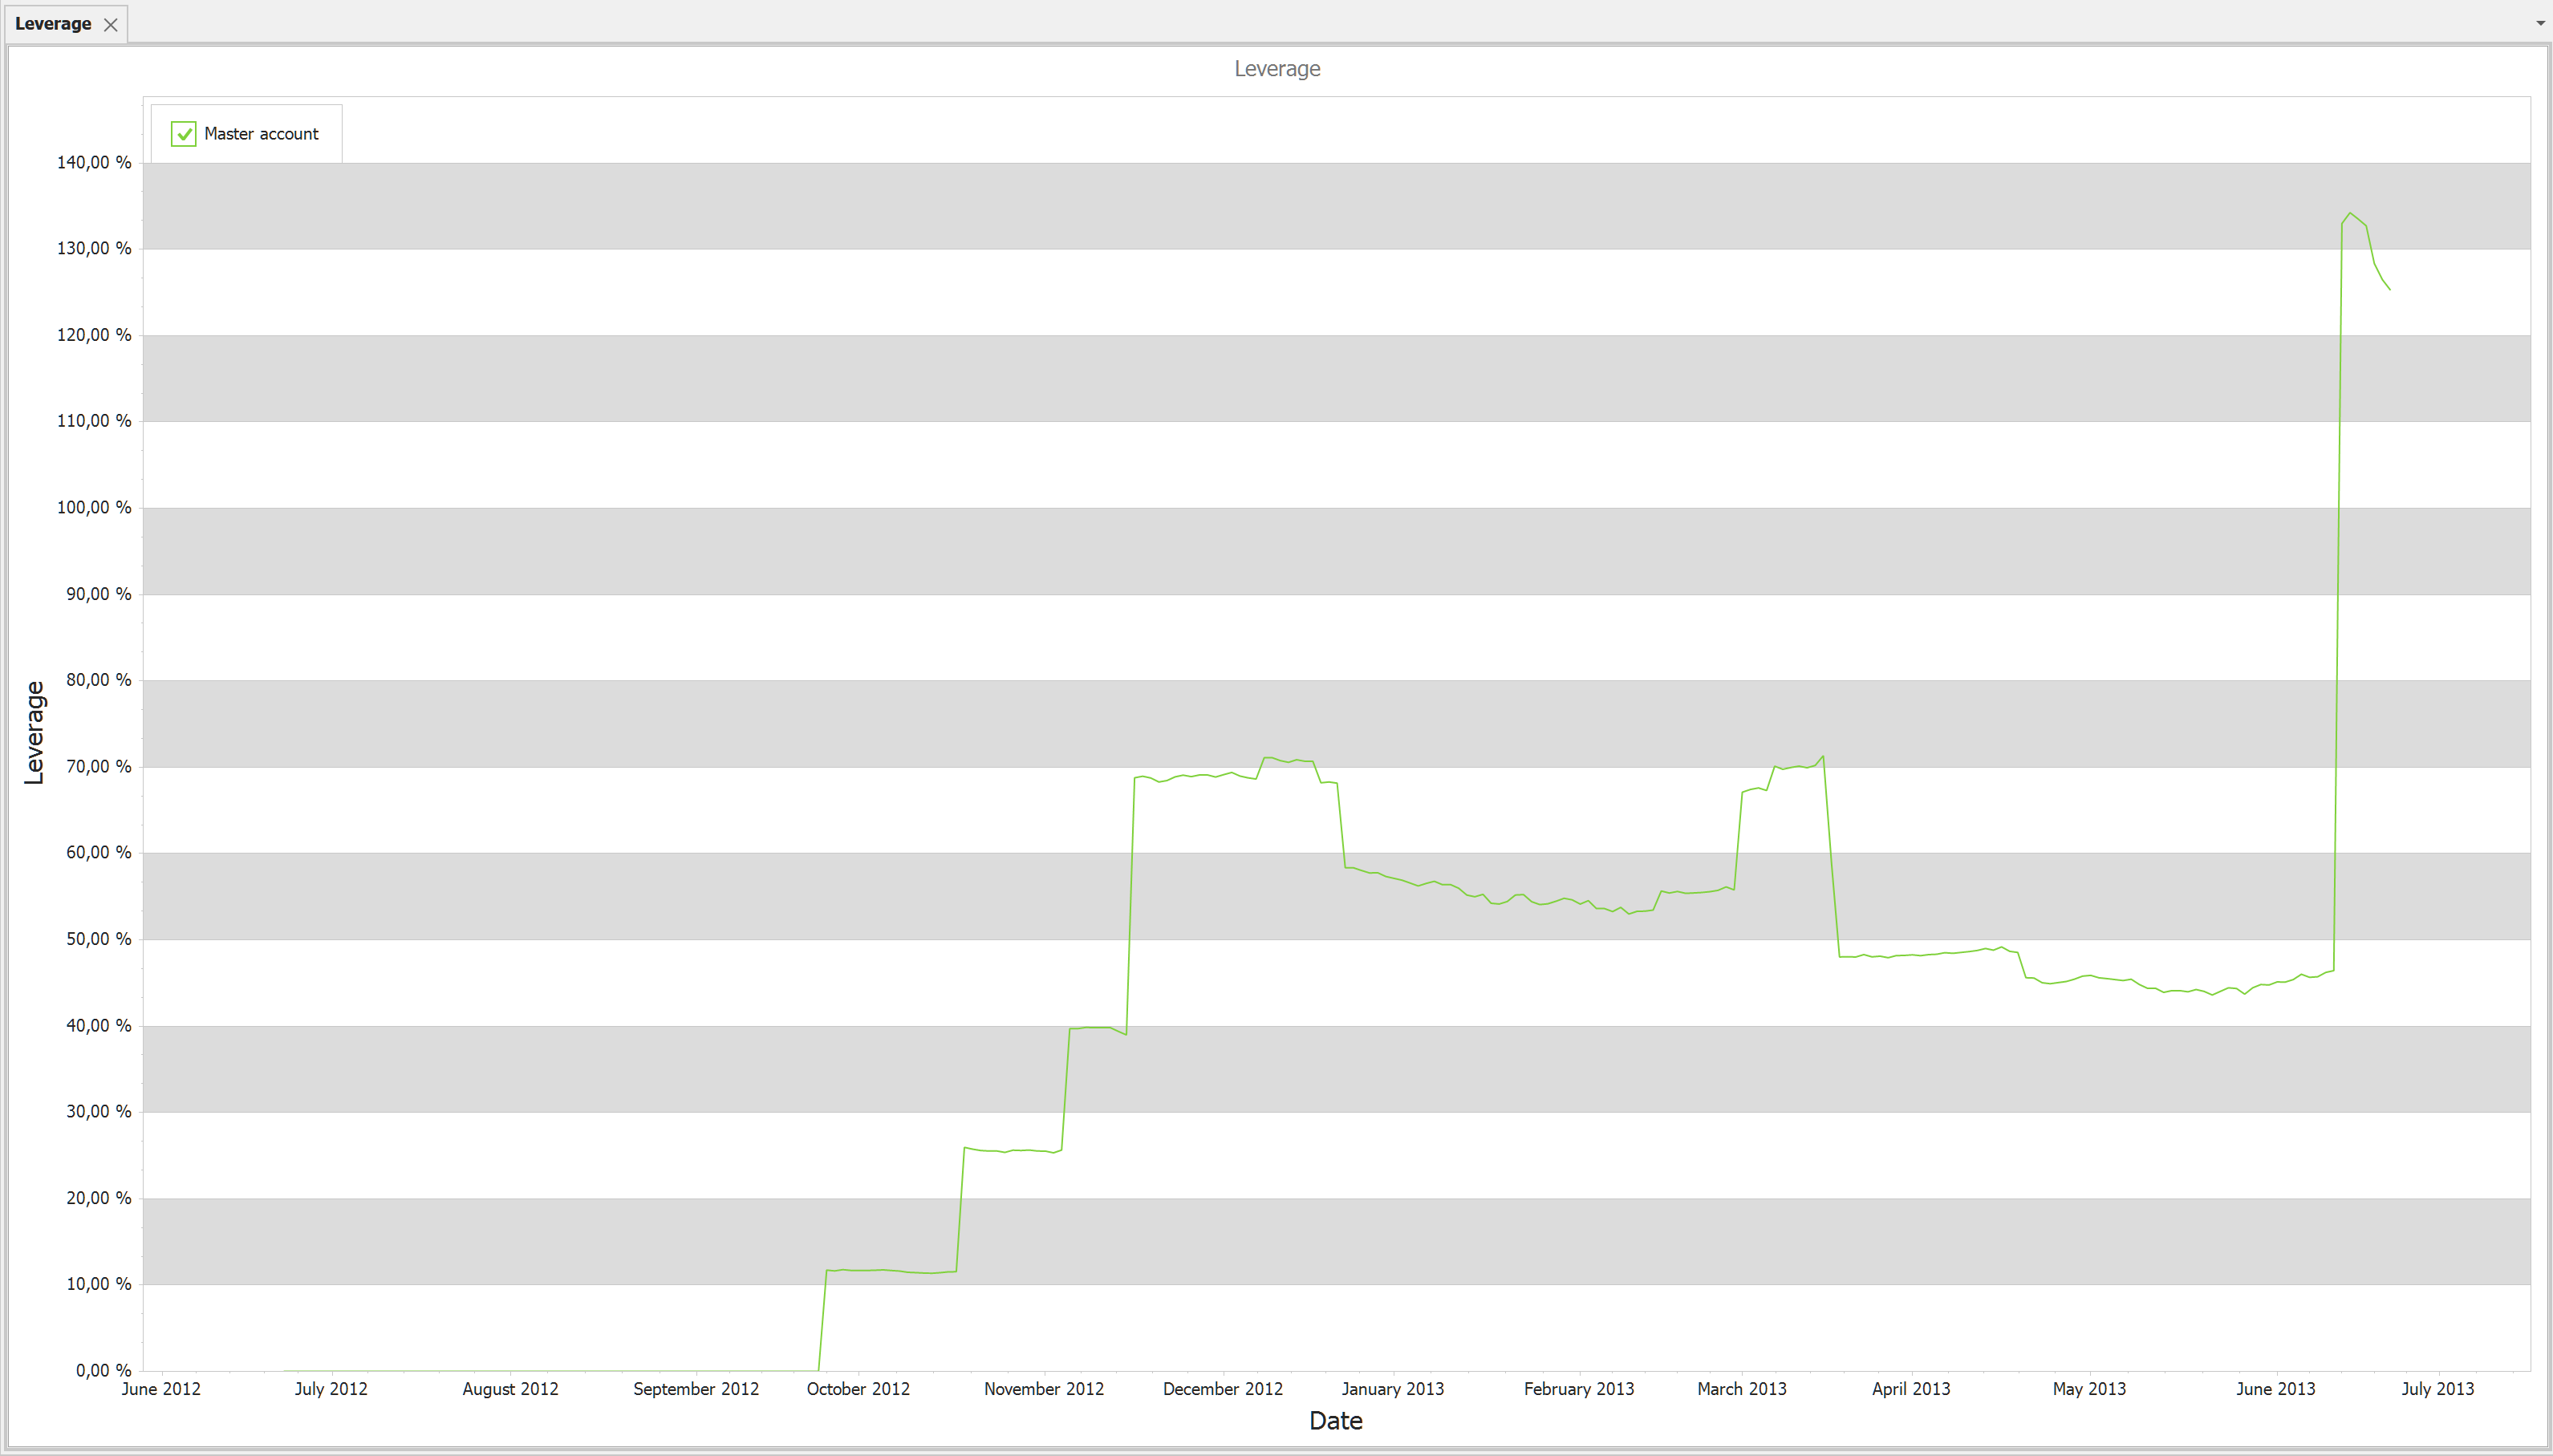
Leverage chart is calculated by dividing the sums of absolute value of open positions amount with the total equity value.
This value is calculated for every trading day.
X Axis: Date
Y Axis: Leverage in percentage
If the total equity is not filled in the leverage chart shows "No Data".
Context menus (right click on the chart):
• Print Preview
• Export To. You can export the report to different formats like HTML, Excel, Word or PDF
• Save Image As. Saves chart as image. Supported formats are: JPG, BMP, PNG
• Copy to clipboard
Settings
• First and Second Lines - You can define constant lines in the leverage chart to set a level of risk.
oVisible - visibility of the line
oValue % - the value in percentage where the line is plotted
oLabel -the label of the line
oColor - color of the line
oTickness - tickness of the line
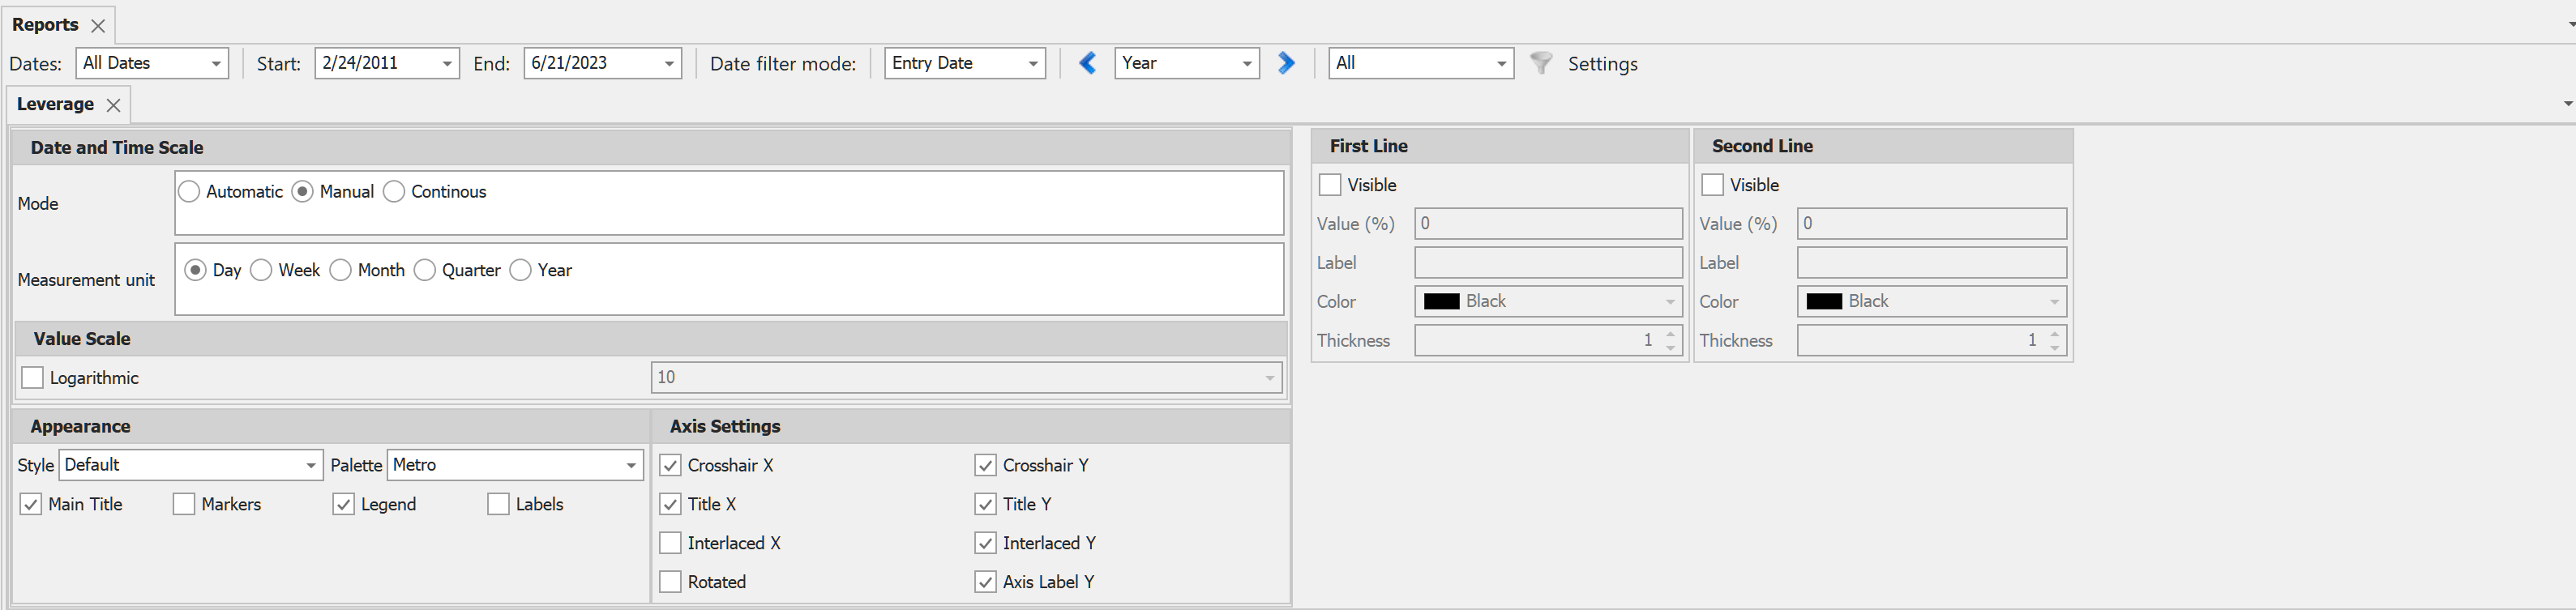
Available filters:
Only date filters are available because the base of the leverage chart is the Total Equity list.
![]() Note. For options and future options the leverage is calculated by the amount of the instrument and not the amount of the underlying instrument.
Note. For options and future options the leverage is calculated by the amount of the instrument and not the amount of the underlying instrument.