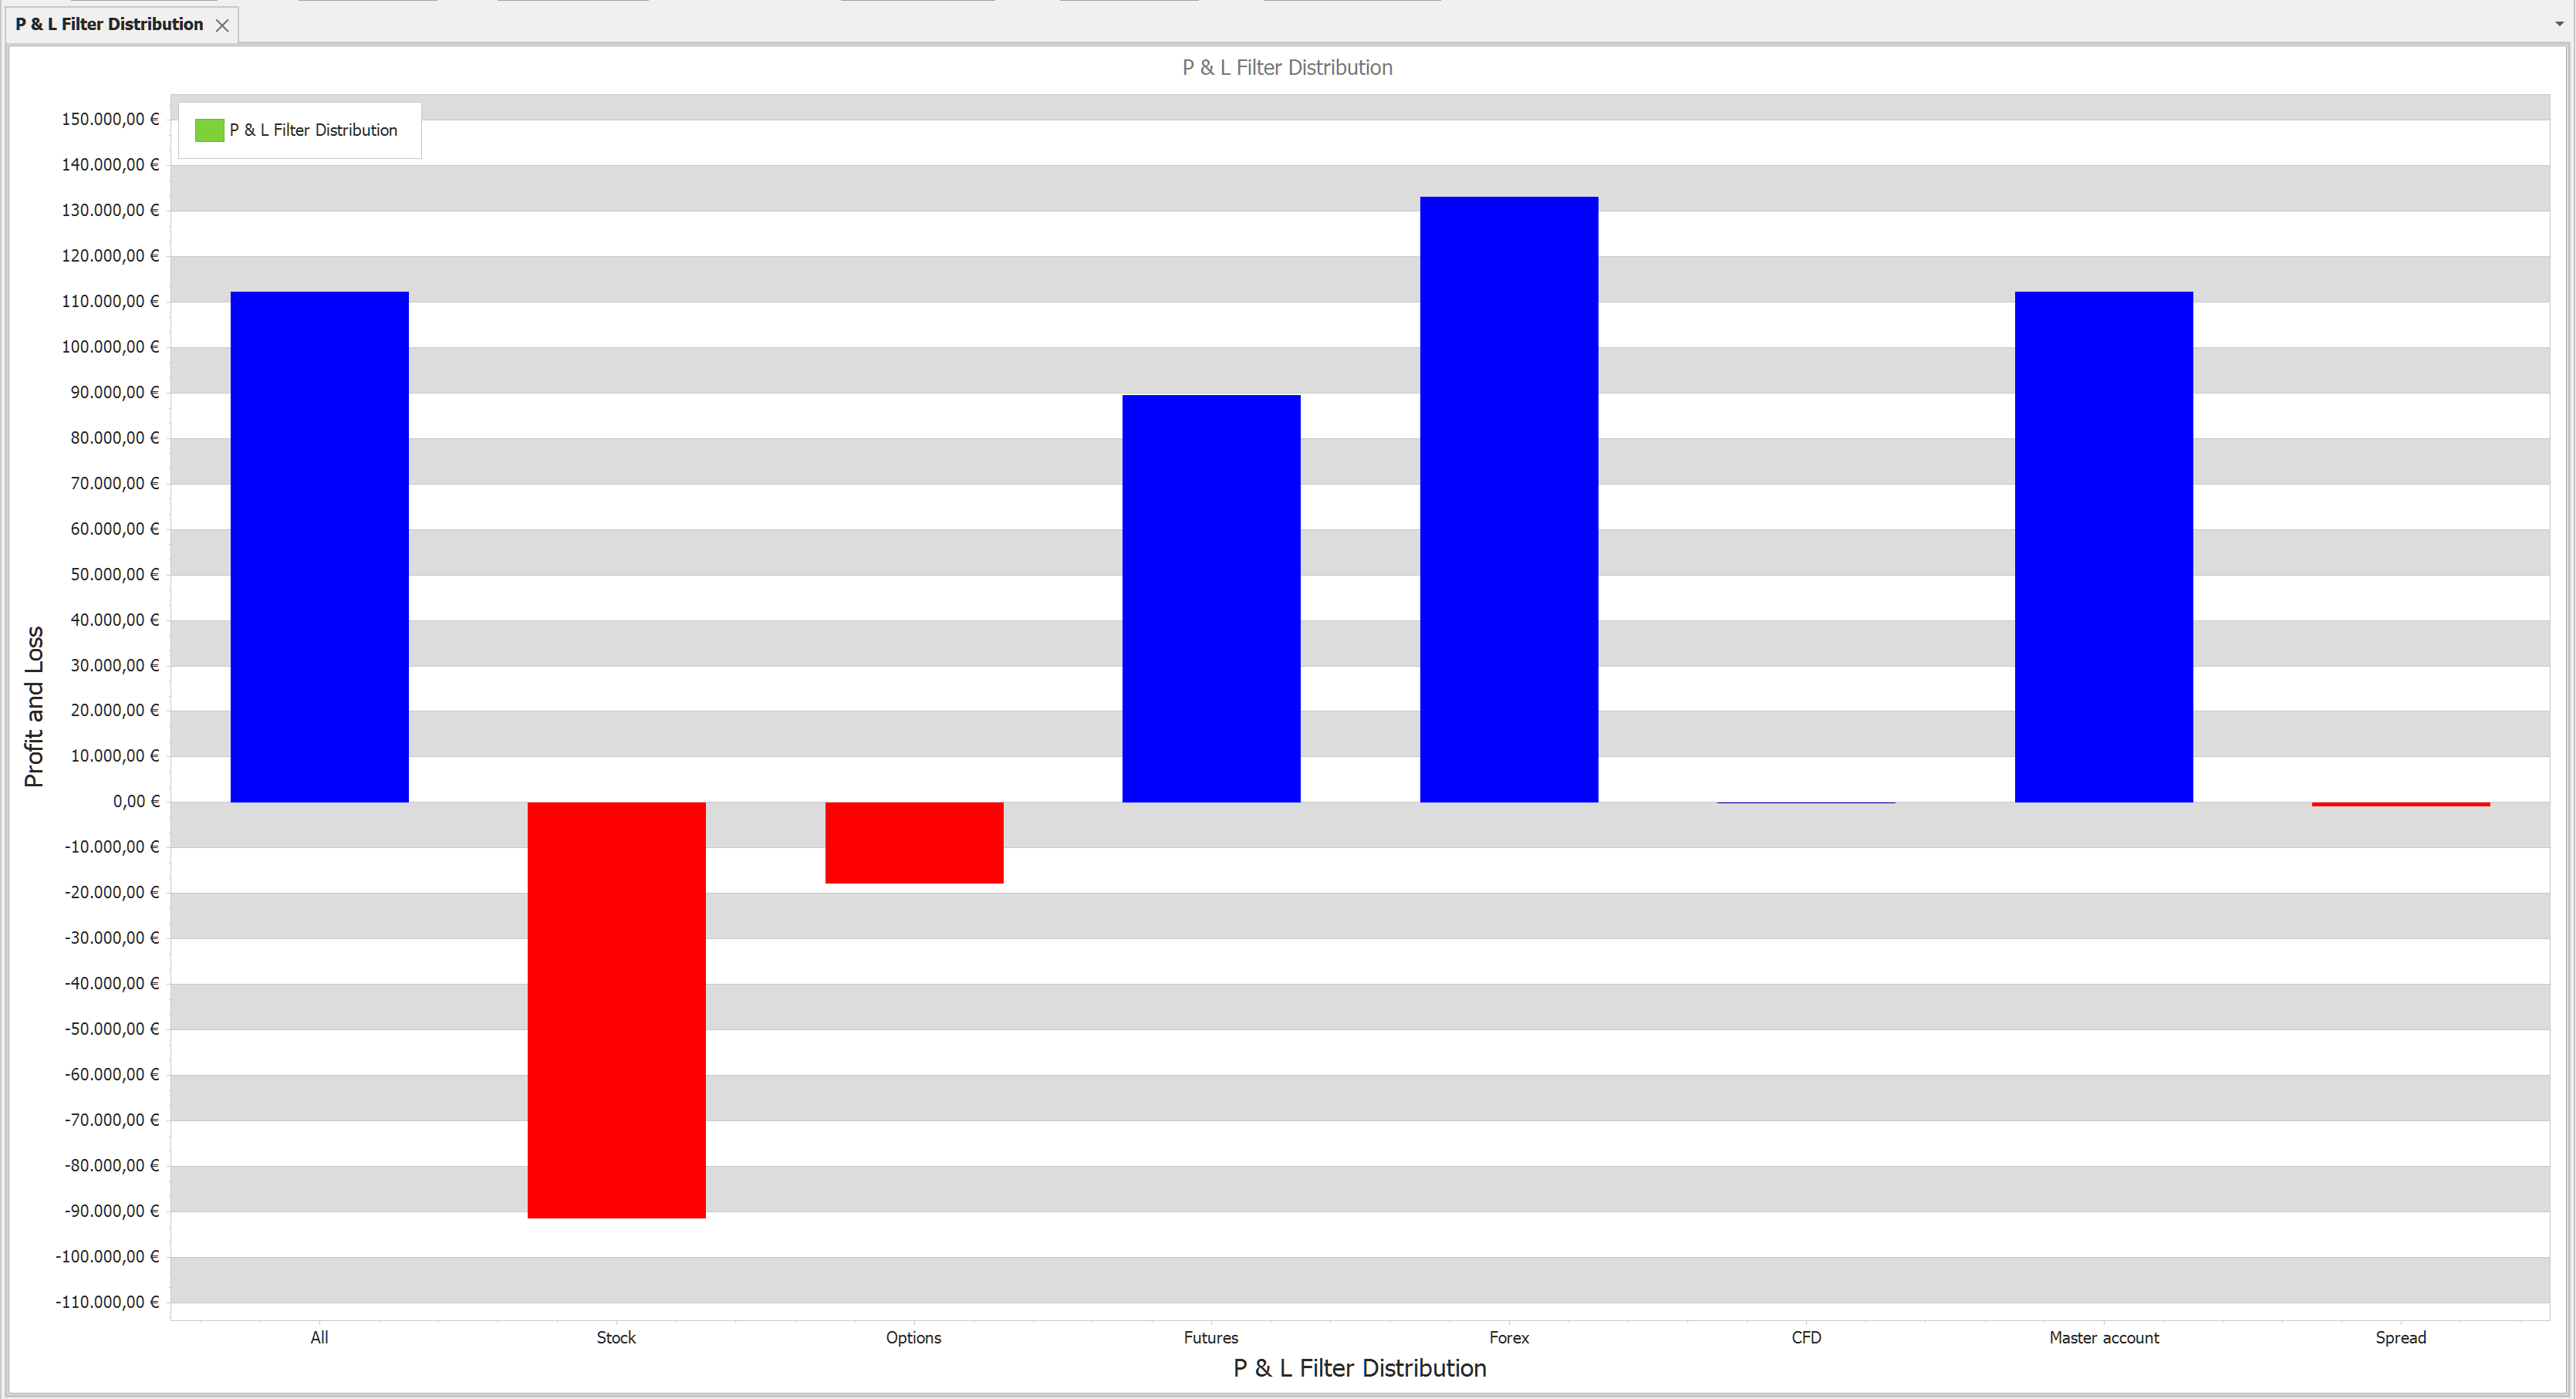
Filter Distribution is a bar chart which shows the P&L distribution by filters.
With this chart you can analyze which position sets aka filters are profitable and which are not.
X Axis: Filter names
Y Axis: Profit and Loss
Context menus (right click on the chart):
• Print Preview
• Export To. You can export the report to different formats like HTML, Excel, Word or PDF
• Save Image As. Saves chart as image. Supported formats are: JPG, BMP, PNG
• Copy to clipboard
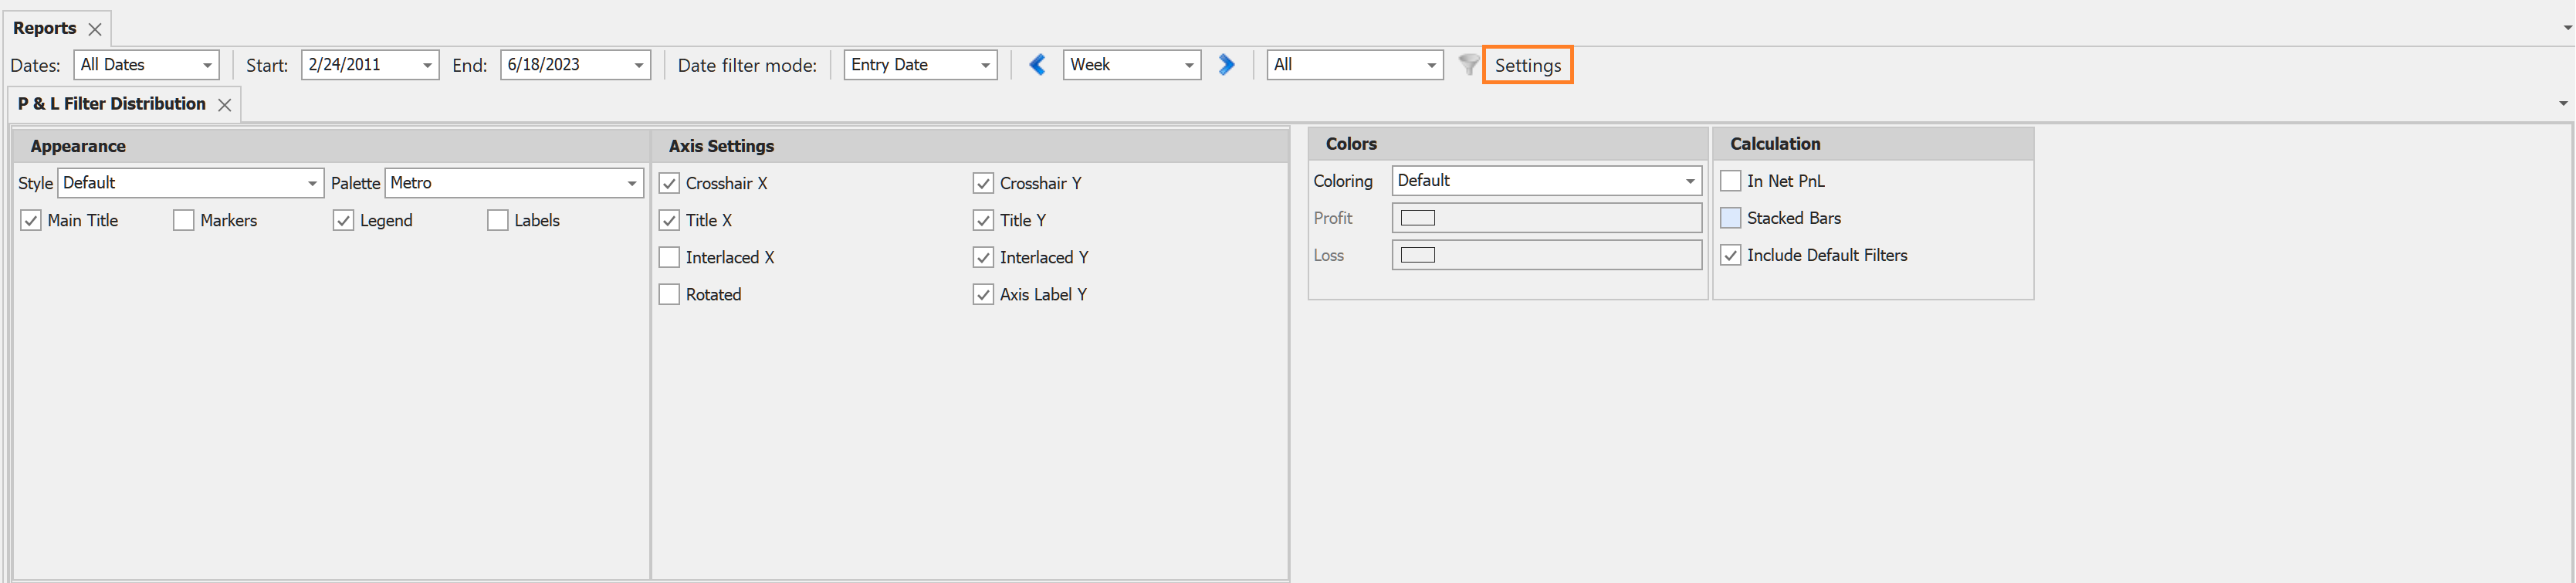
Settings
• Colors. you can change the Profit or Loss color or use the default values defined under the Options Look and Feel settings.
• Calculation
oIn Net PnL. Displays the Net PnL values instead of the PnL.
oStacked Bars. Stacked bars displays the percentage of the Profit vs Loss.
oInclude Default filter. If this checkbox is ticked the default predefined filters will be plotted as well.
Available filters:
All filters are available.