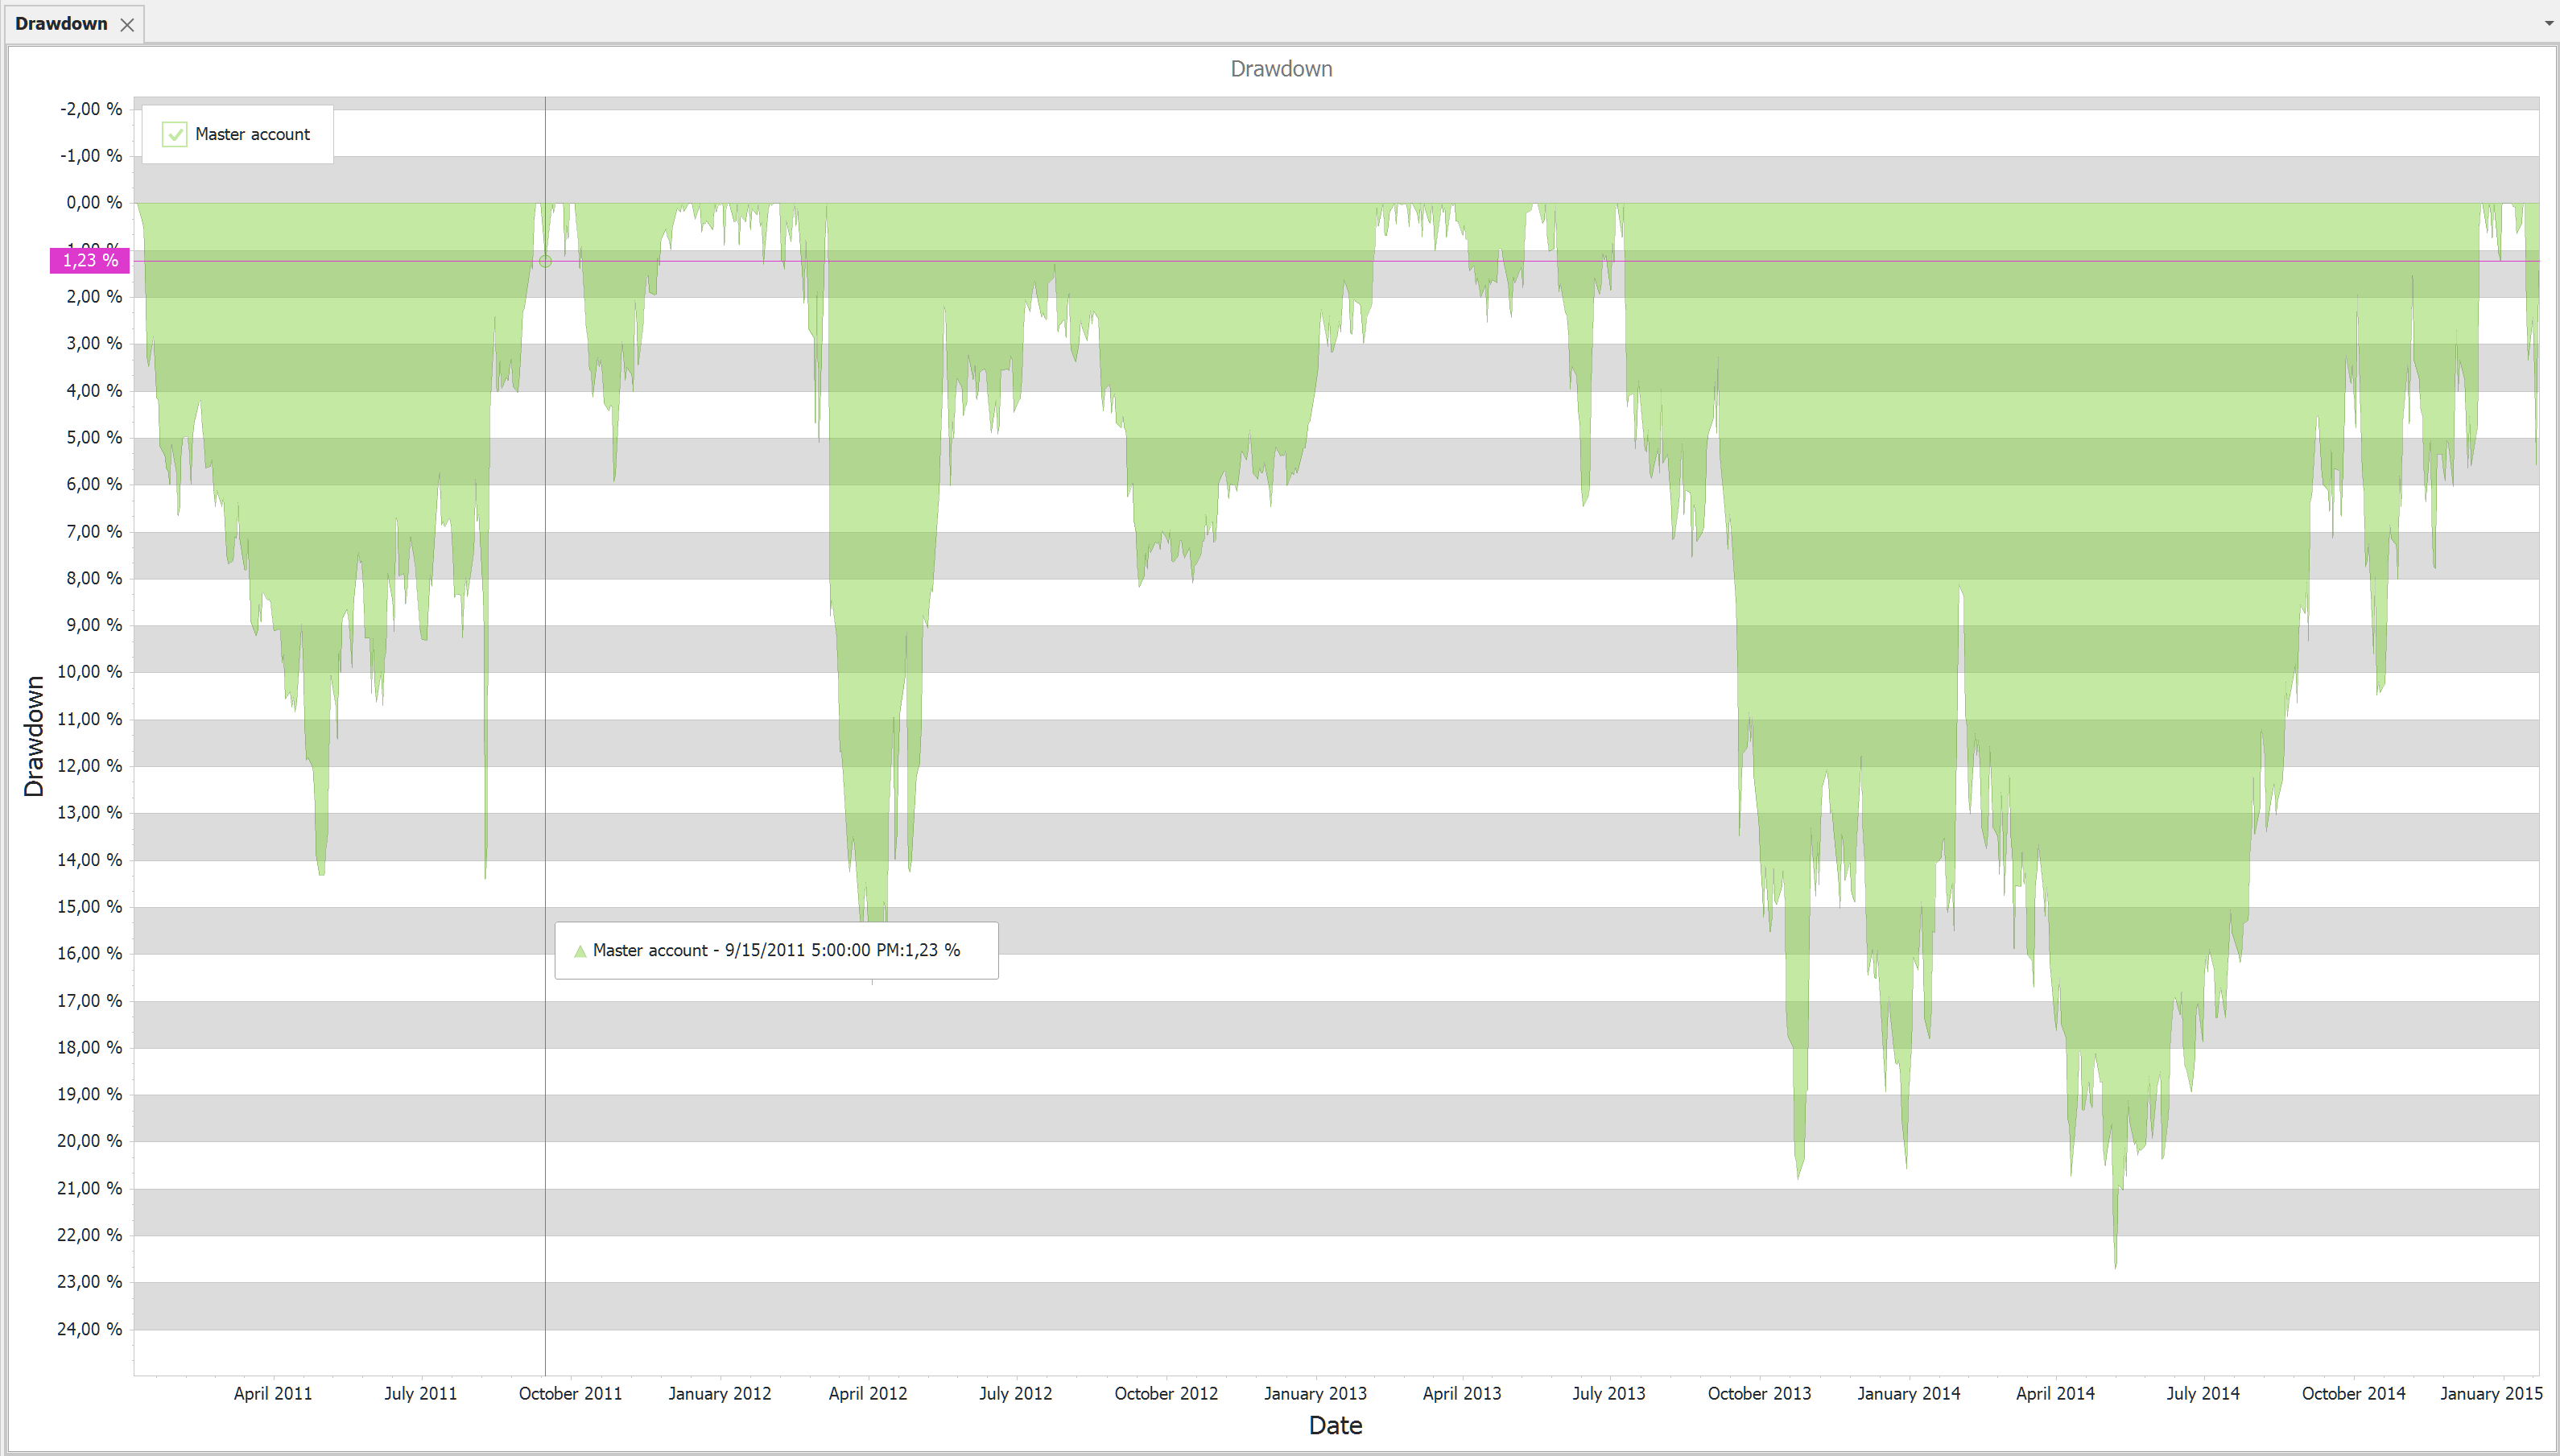
Drawdown is the measure of the decline from a historical peak of the Total Equity list.
You can find the calculation method at wikipedia's drawdown page and a small description in the Basic Definitions chapter.
X Axis: Date
Y Axis: Drawdown in percentage
As the drawdown chart is based on the total equity, if it is not filled in the chart shows "No Data".
Context menus (right click on the chart):
• Print Preview
• Export To. You can export the report to different formats like HTML, Excel, Word or PDF
• Save Image As. Saves chart as image. Supported formats are: JPG, BMP, PNG
• Copy to clipboard
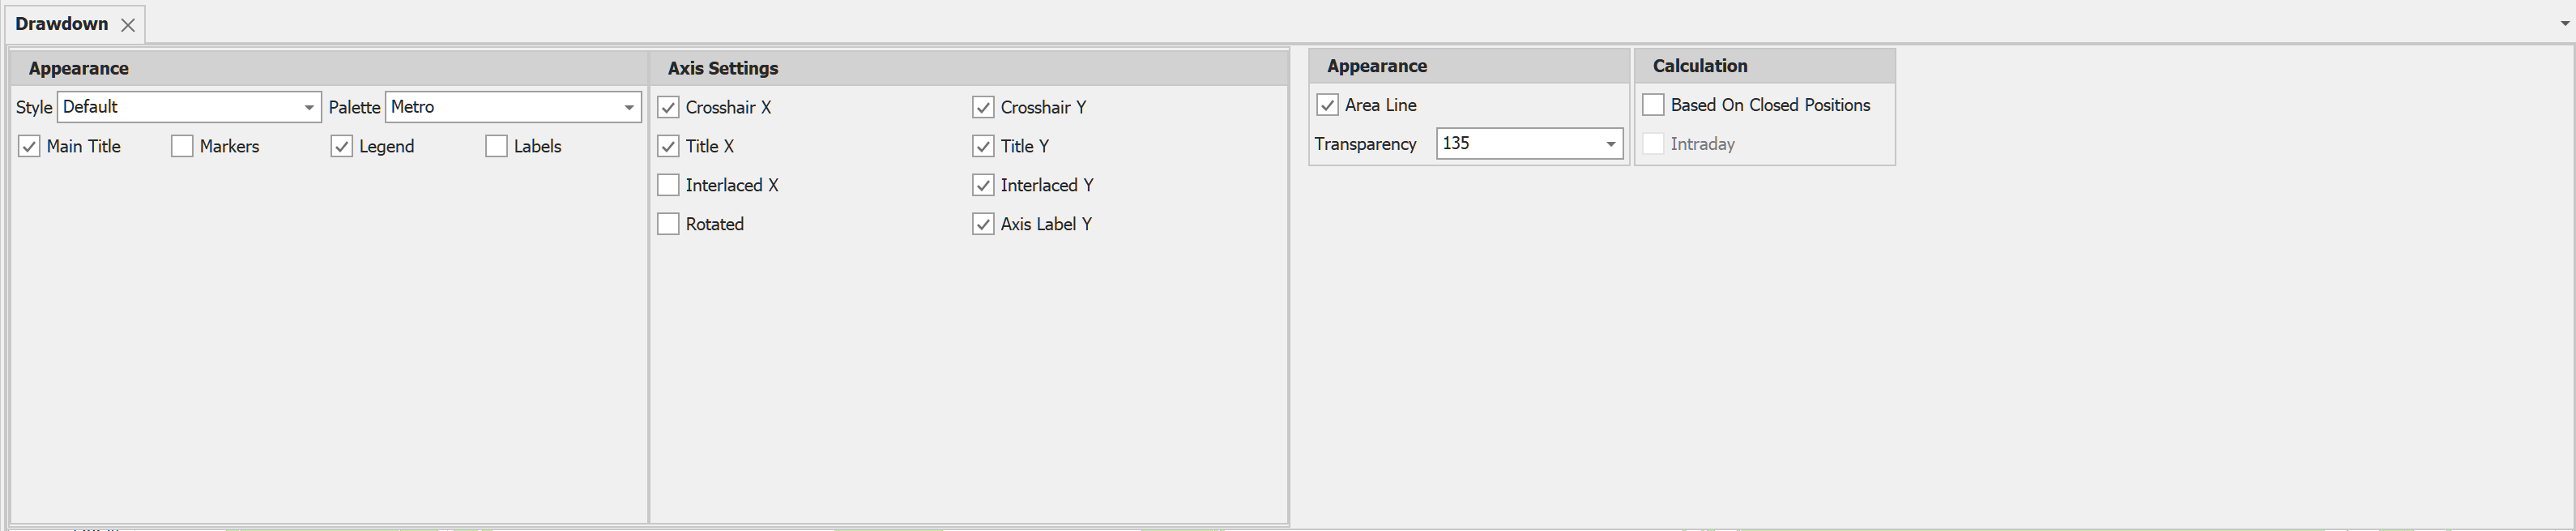
Settings
• Area Line - Switches between area line chart and simple line chart
oTransparency - If the area lineis set the transparency of it can be set in this option
•Based on closed positions - the drawdownis calculated byusing the closed position instead of the Total Equity values
oIntraday - calculate intraday values as well in case of closed positions option is set
Available filters:
Only date filters are available because the base of the Drawdown is the Total Equity list. If the drawdown is based on the closed positions then all filter are available.