Pivot grid is a very useful tool to summarize the position metrics in a compact form. It allows you to quickly summarize and analyze large amounts of data in lists and tables by dragging and dropping columns to different rows, columns, or summary positions.
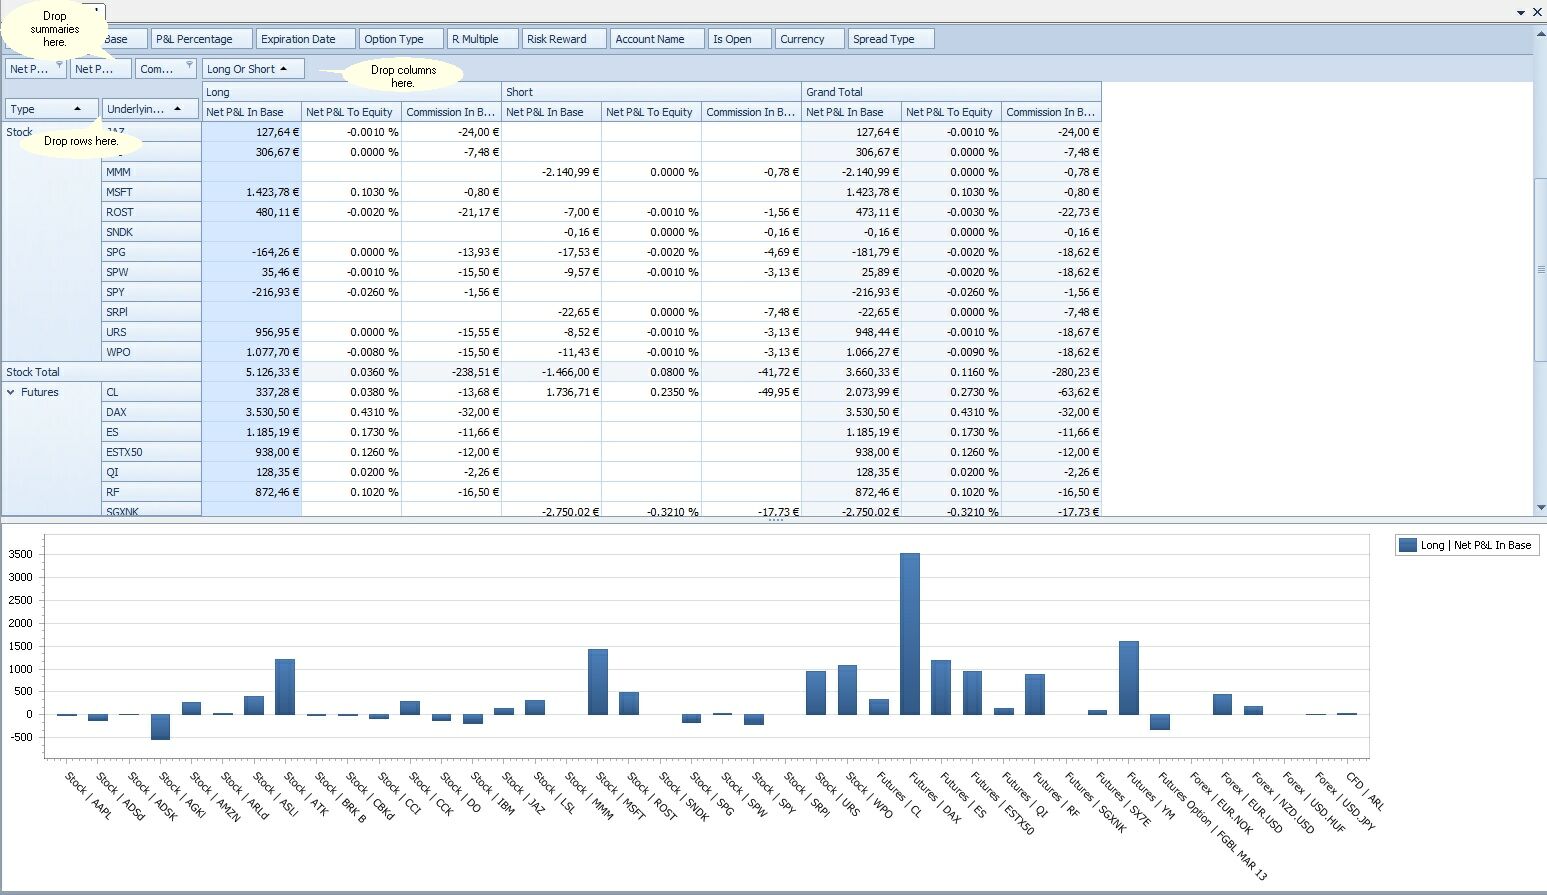
To add a new metric to any of the three sections (rows, columns and summary position) simply drag the selected field from the selection boxes at the top and drop it below the columns/rows as it is shown in the screen shot.
The Pivot Grid is attached to a chart control. If a couple of cell are selected then chart will display the cell values in a bar chart.